Using ODK-X Tables
ODK-X Tables is a program that allows you to visualize and update existing data. Using Tables as your entry-point to data collection, you will be able to gather data using ODK-X Survey, sync it to a server using ODK-X Services, and have other users download and edit this same data on their own devices.
Tables also enables web developers to build powerful data management applications to handle their complex workflows. While Survey follows a traditional data collection workflow, similar to that of Collect, Tables gives you the flexibility to implement your own arbitrary complex workflow. For example you might collect data via a customized mapping interface: Tables allows you to build an application using web technologies to achieve that.
Note
ODK-X Tables only works on Android 4.2 and newer devices.
Note
Please note that ODK-X version 2.1.9 does not support Android 4.x. Its minimum Android version is 5.0.
We have included a sample application built on top of Tables along with a handful of data tables that showcase some of its features in Trying Out ODK-X Tables.
Learn more about ODK Tables
Prerequisites
If you have not installed Tables already, follow our guide for Installing ODK-X Basic Tools
Custom Home Screen
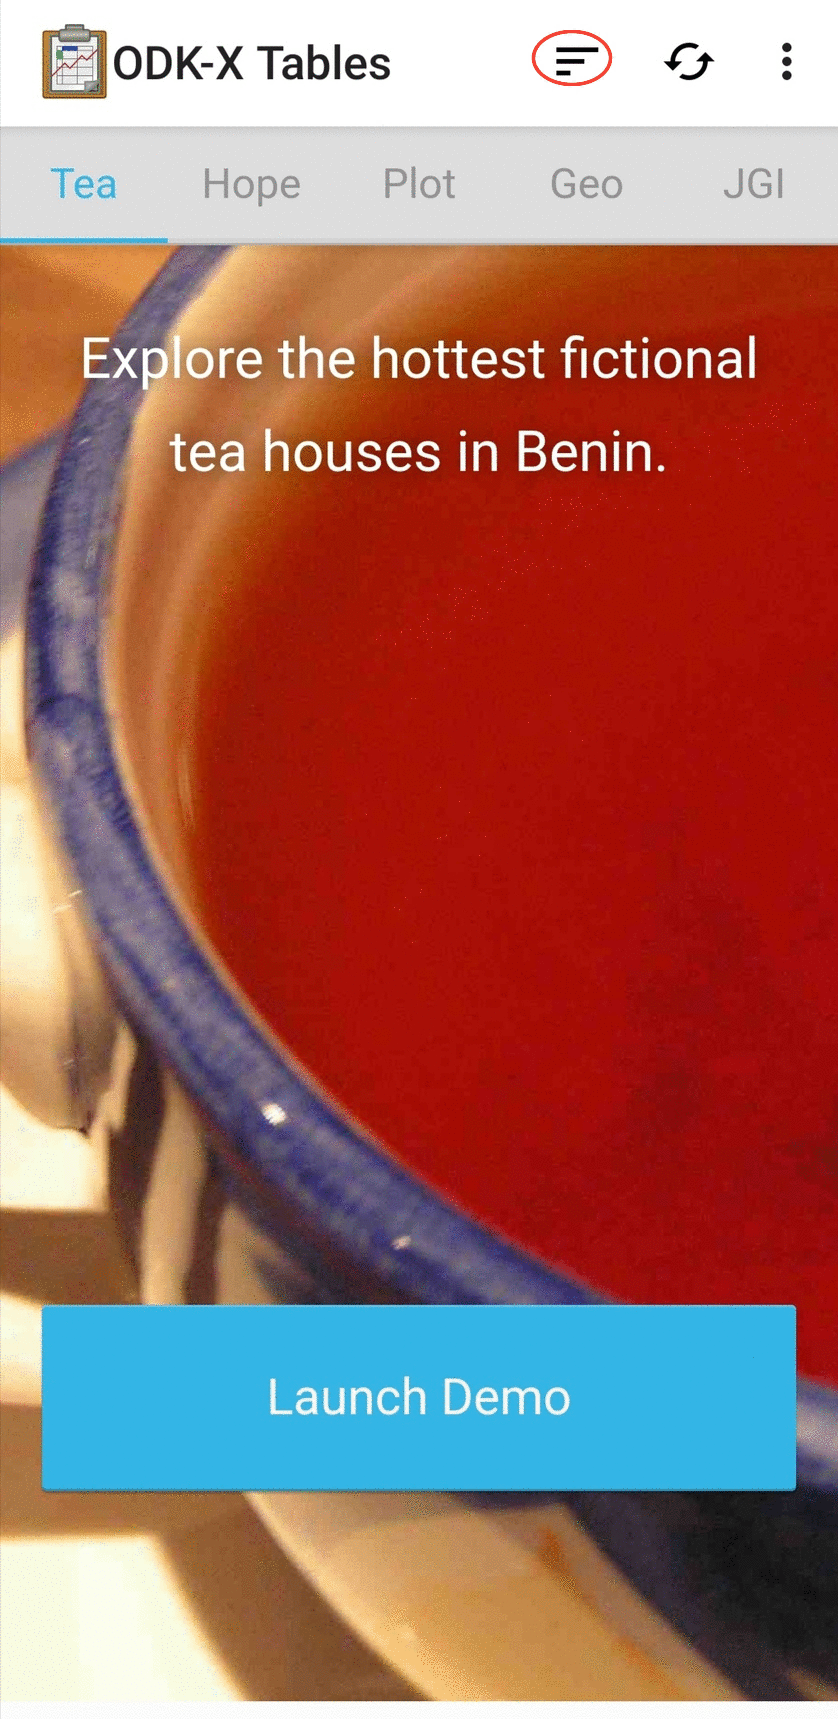
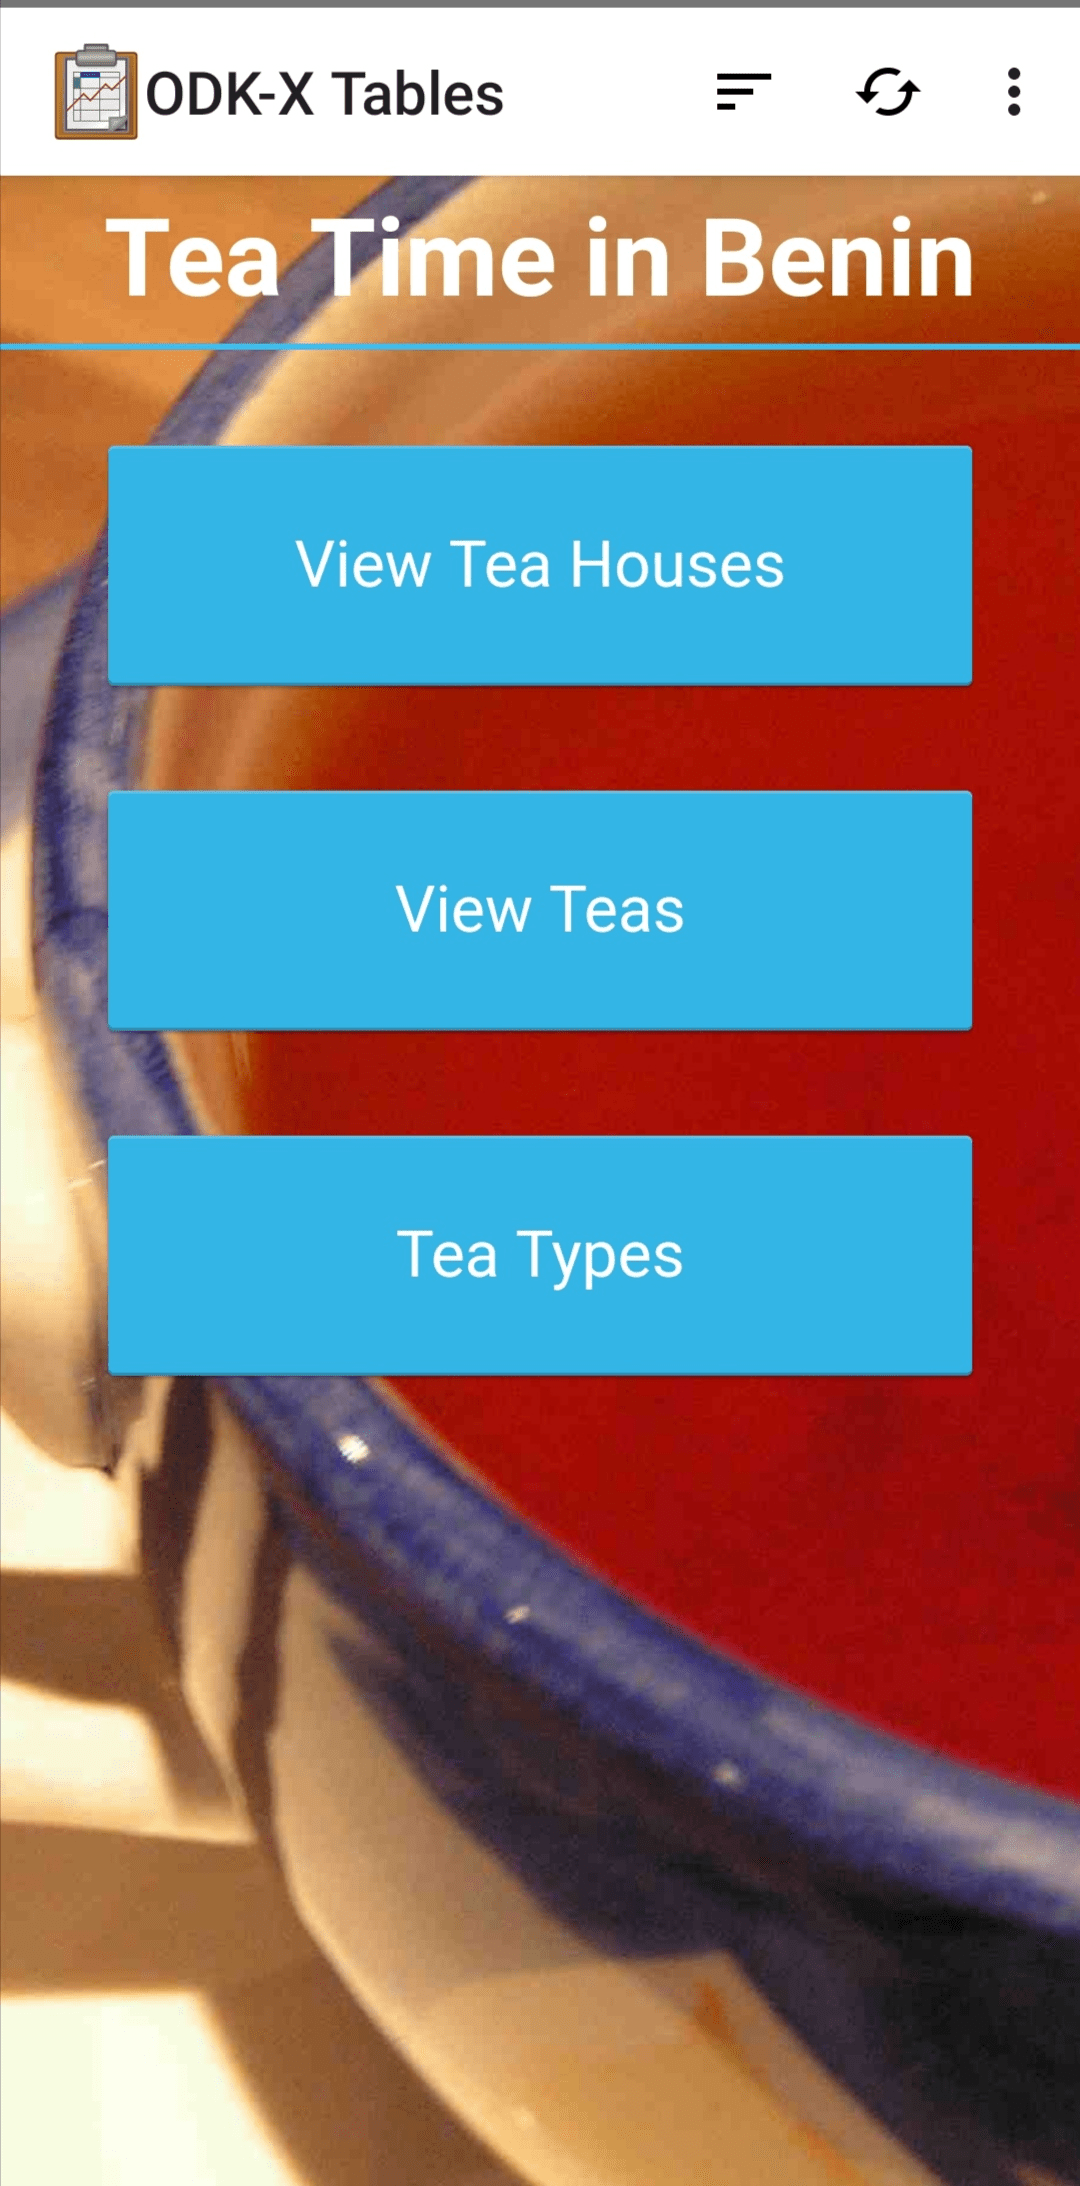
The custom home screen is an HTML file written by your organization to customize the look-and-feel of using Tables. If a custom home screen is provided, by default it will be the first screen shown after opening Tables.
Showing/Hiding the Custom Home Screen
To hide the custom home screen and see the Table Manager for a list of data tables on the device:
Open Tables. On the custom home screen press the button with three lines in the upper right.
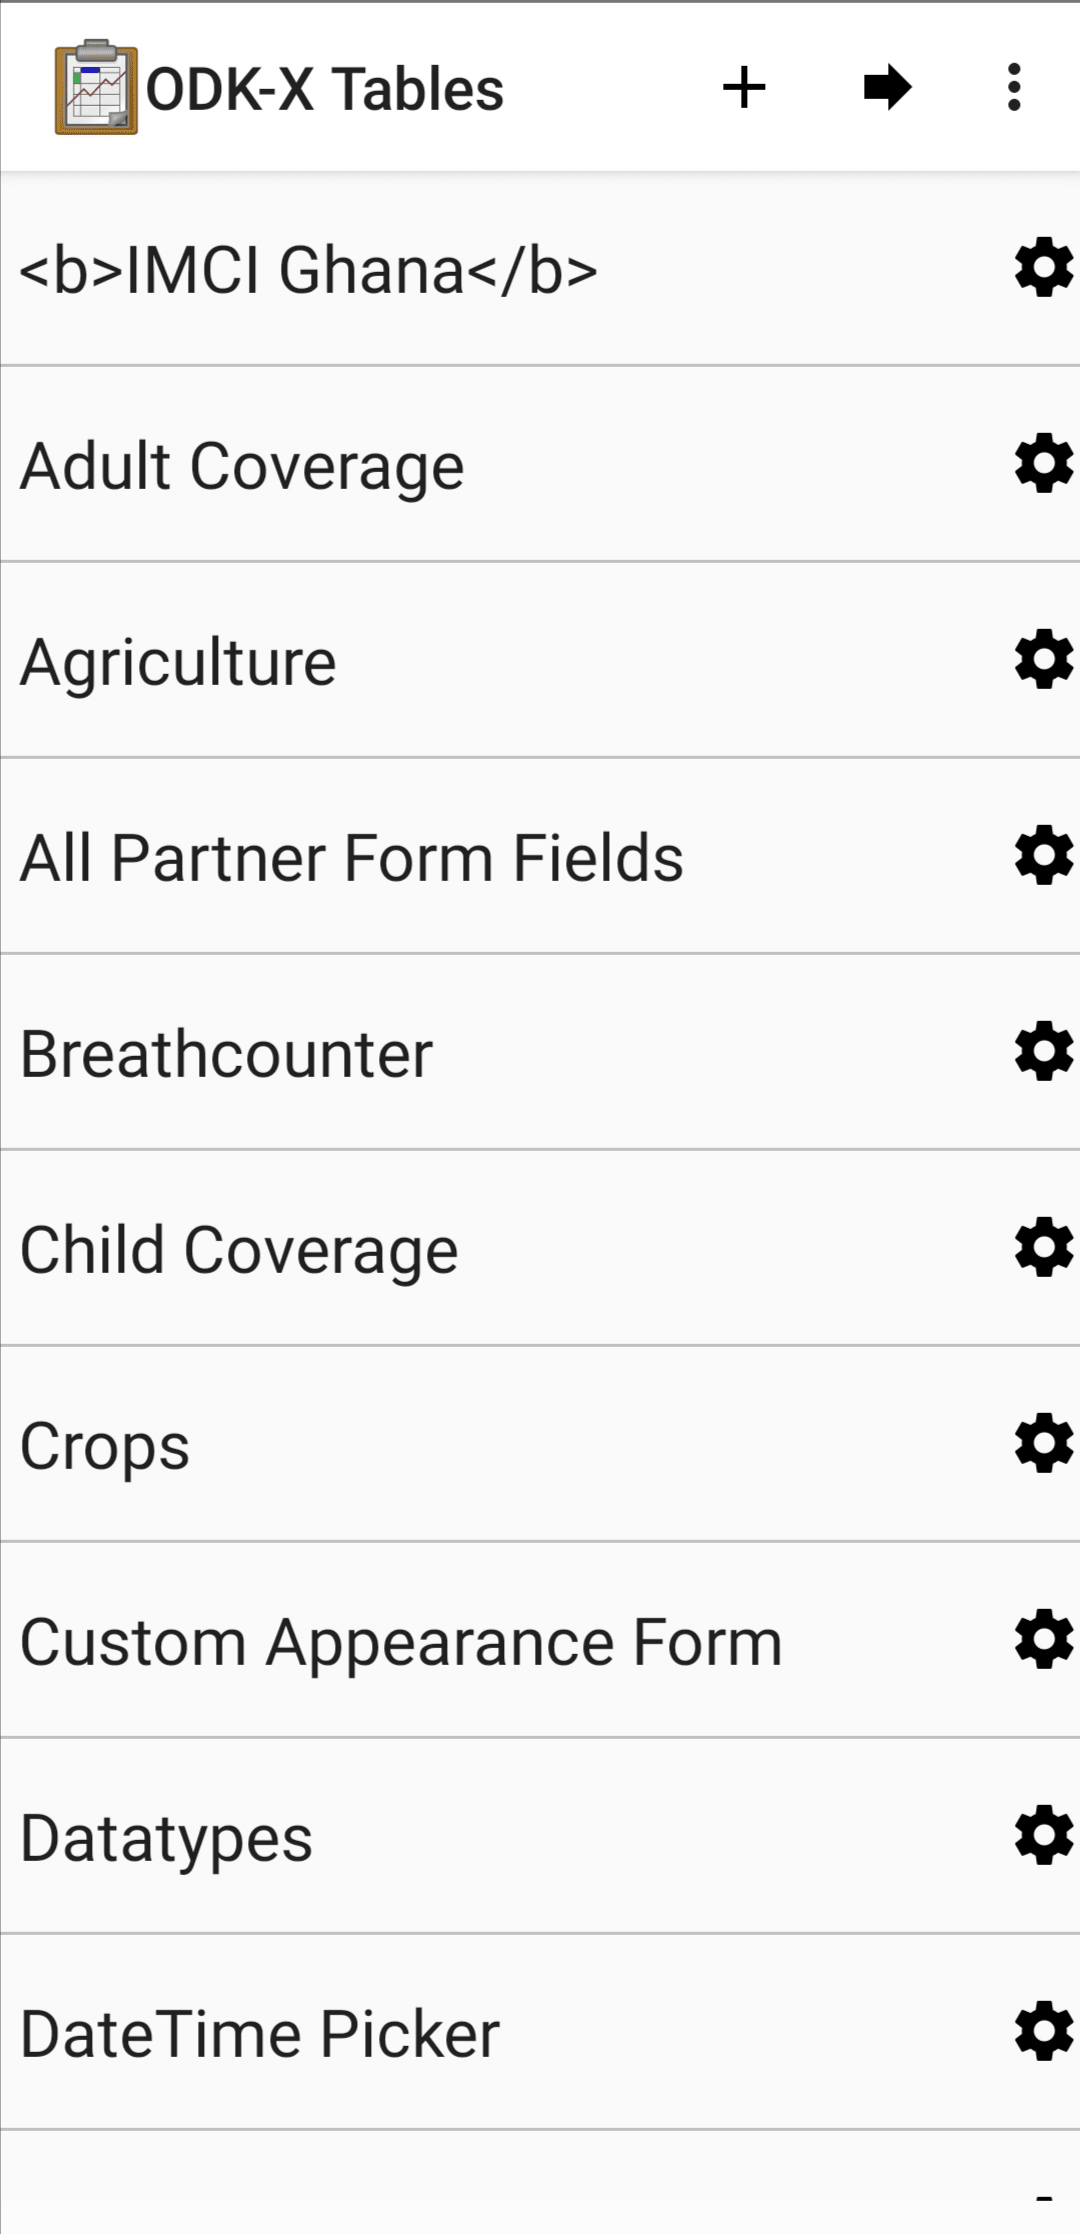
The Table Manager will be visible with a full list of data tables stored on the device.
To return to the custom home screen press the back button in your Android navigation buttons.
Warning
You may need to enable the custom home screen before it will appear.
Enabling/Disabling the Custom Home Screen
To enable or disable the use of the custom home screen, follow the instructions for Tables Settings.
Table Manager
The Table Manager allows you to modify table settings, delete tables, and import or export data into your tables. See the Table Manager instructions for details.
Viewing Data
Tables supports viewing collected data in a variety of formats. Survey allows you to review individual form instances, but Tables lets you view full data tables as well as create your own customized visualizations. This is a significant departure from the form-based model of data collection, and allows you to manage data directly on the device.
View Types
Tables offers a number of view options for presenting data. The person at your organization who built this ODK-X Tables application will have already configured these options, so you may not always have a choice in how you view your data. These view types are:
Warning
Many of the view types in Tables are customizable. This guide will provide some basic outlines of how to use these view types. However, for more accurate instructions you may need to contact the person who built or manages your organization’s ODK-X Tables application.
Spreadsheet View
Spreadsheet View is the only view option that will be the same for all Data Management Applications. It is not customizable. It serves as a reliable way to view all of the data stored in a table on the device.
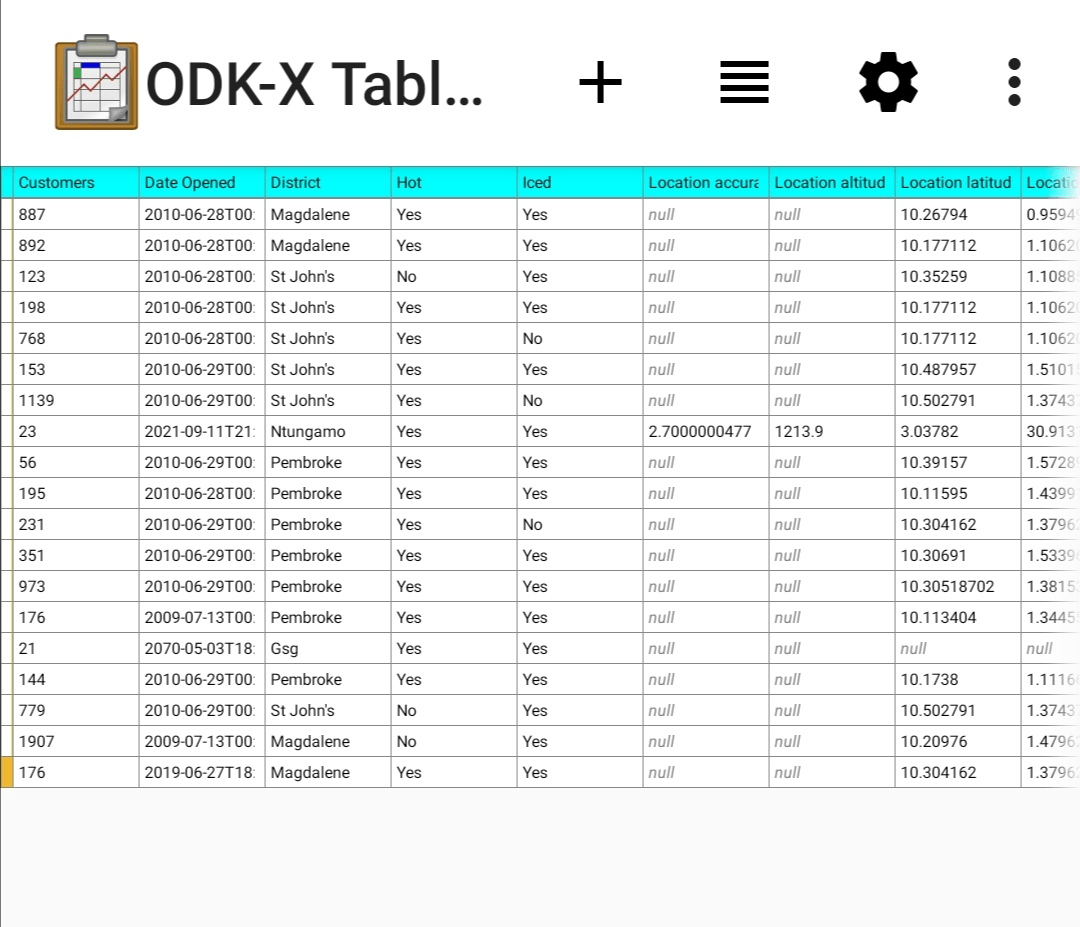
It is intended to have the familiar view as if you were using a spreadsheet program such as Excel. Each row represents a data record, which often (but not always) corresponds to a form instance created by Survey. You can scroll up and down to view all of the records, or left and right to see each column.
The thin column on the left is called the status column: it will show a different color based on the status of that row.
White (clear) – The row is downloaded from the server and has not been modified.
Yellow – The row is modified.
Green – The row is an entirely new row
Black – The row is deleted. It will show as black until you sync with the server and publish those changes.
Custom color rules can be set in table properties. They change the colors of spreadsheet cells based on the values of those cells. This can be useful in browsing larger data sets for records that meet certain criteria. For example, you might be recording crop heights and mark all cells with heights above a certain height as impossible so that they can be revisited or removed. For details on setting these color rules, see the color rules guide
Spreadsheet view can also be used to edit data. See the Spreadsheet View editing guide for further instructions.
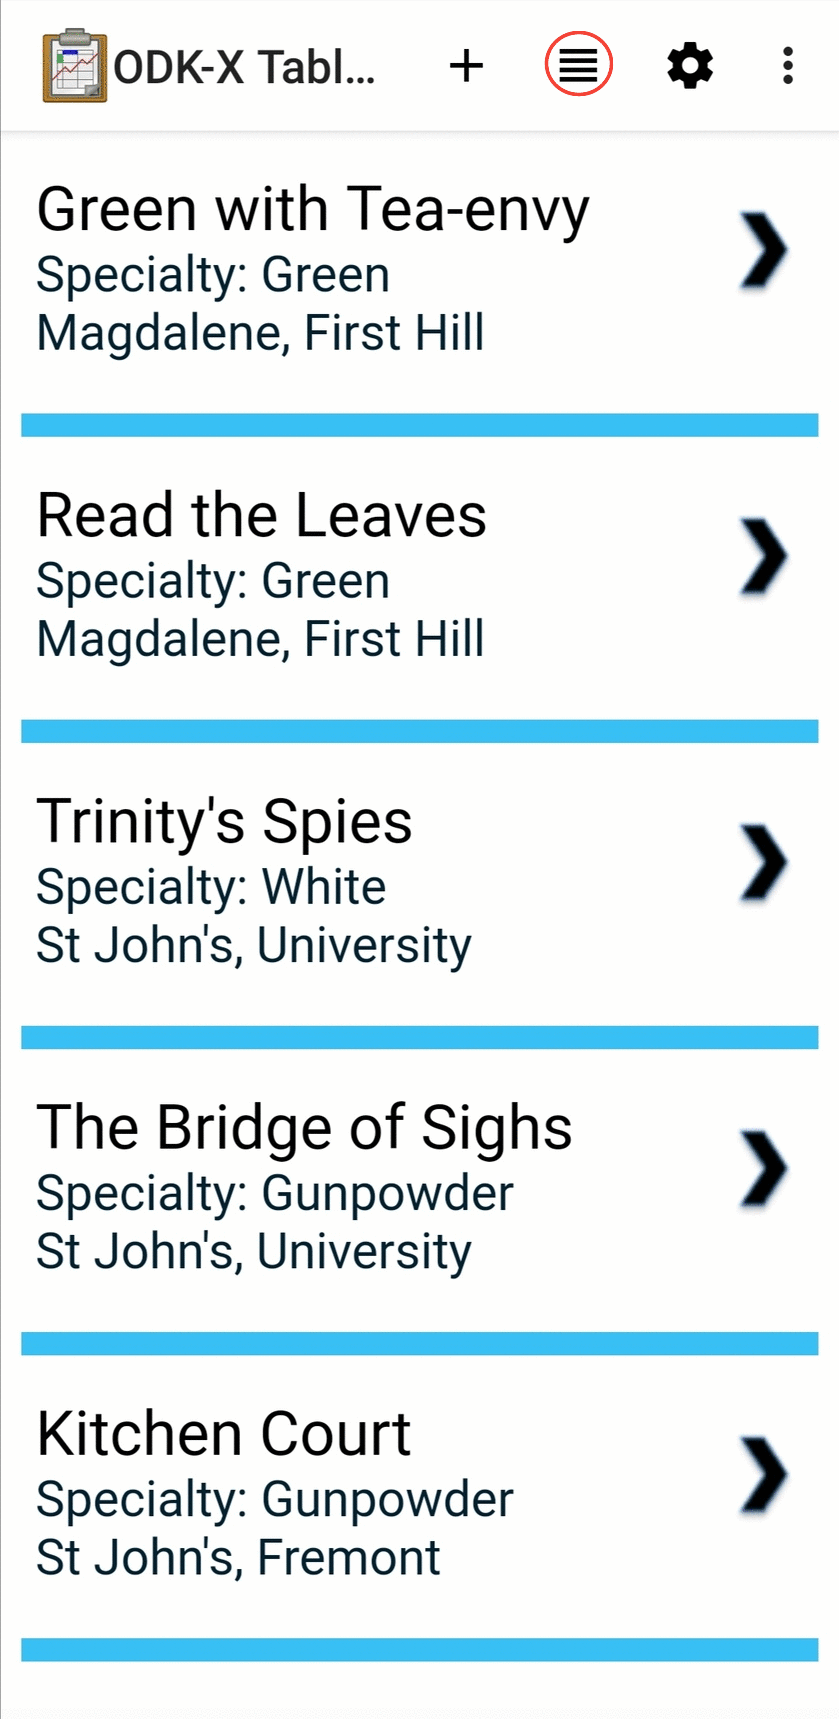
List View
List View is a customizable view that will change based on your Data Management Application's code. In general, it is used to render a list of records from a data table, displaying only a few key values for each record.
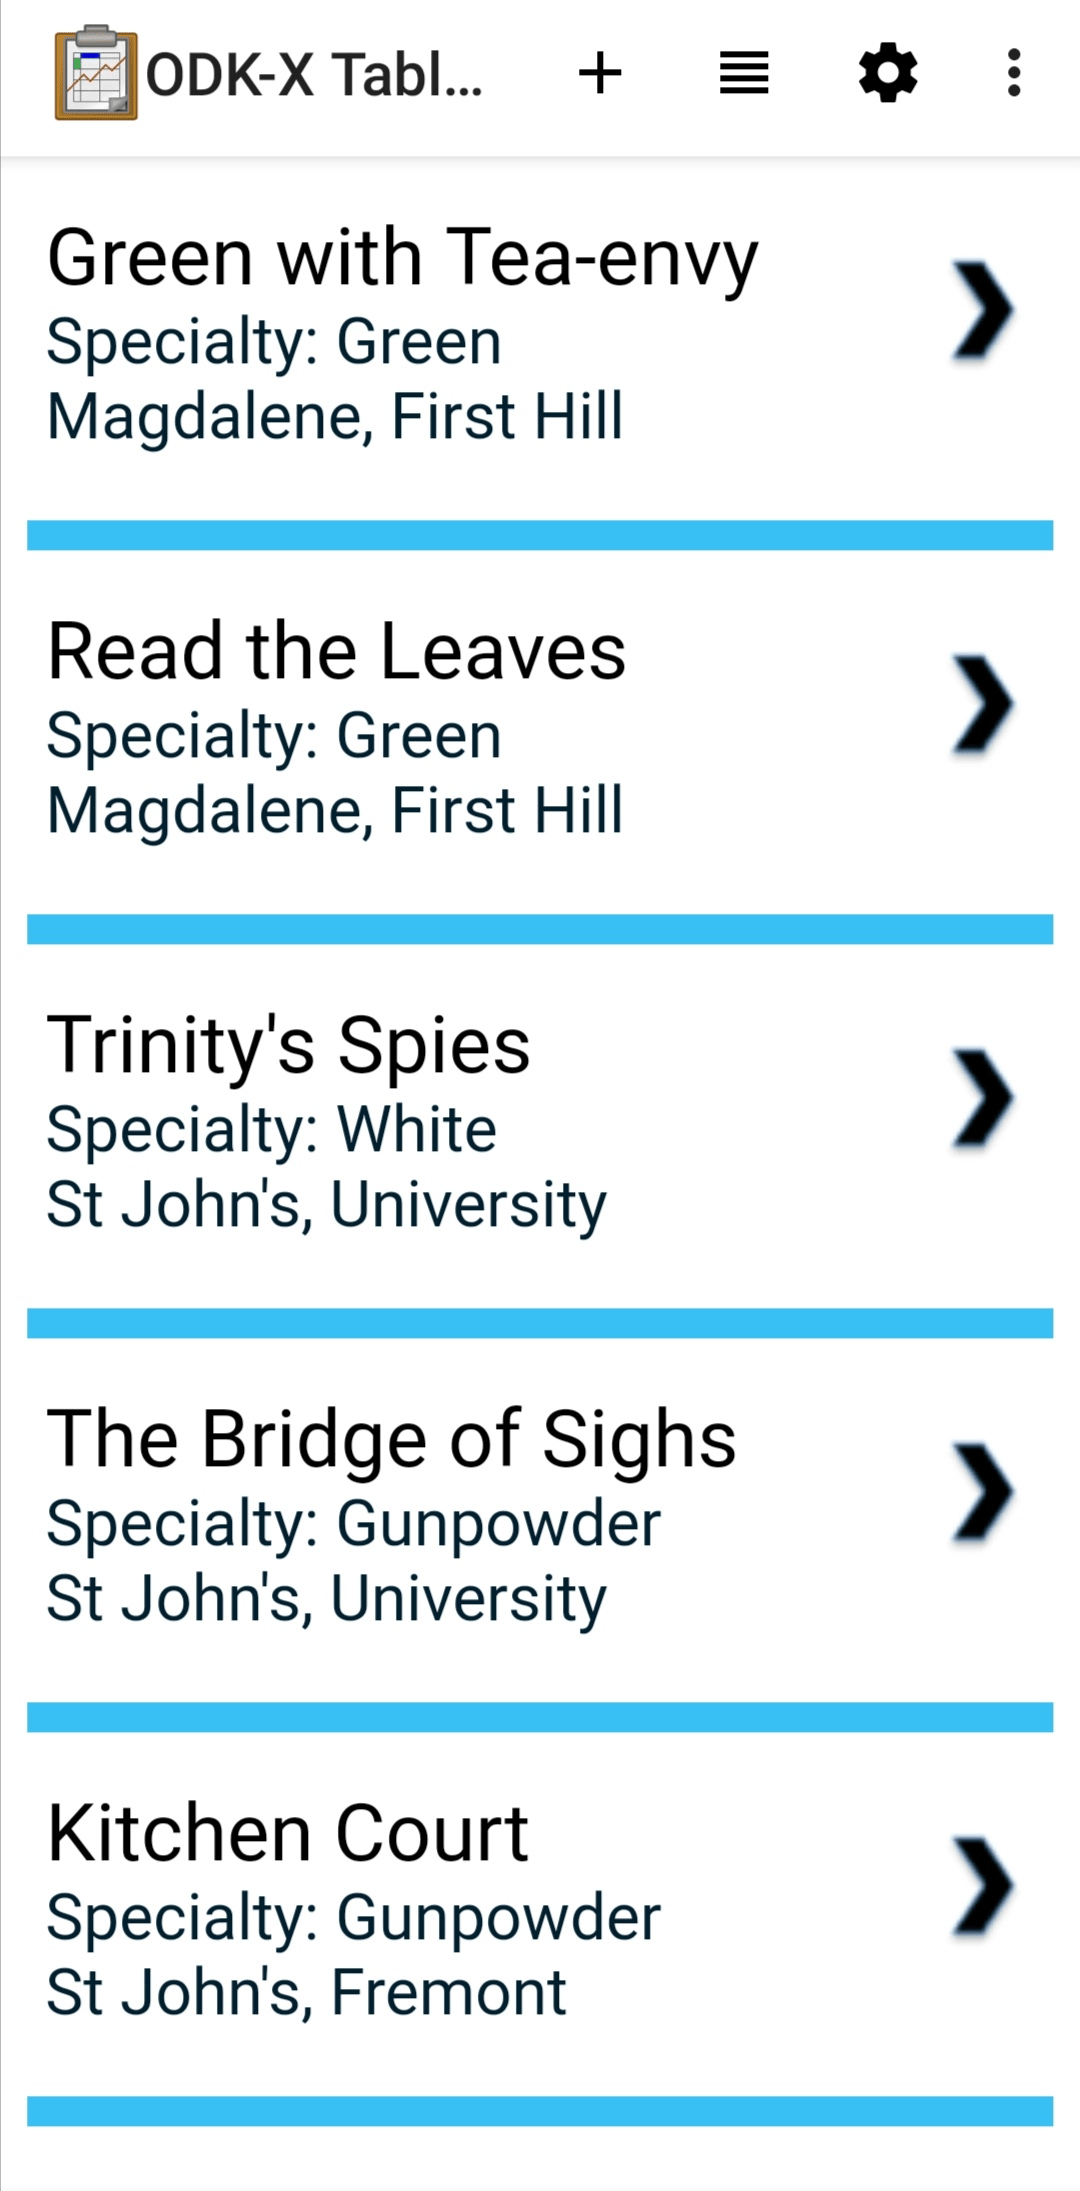
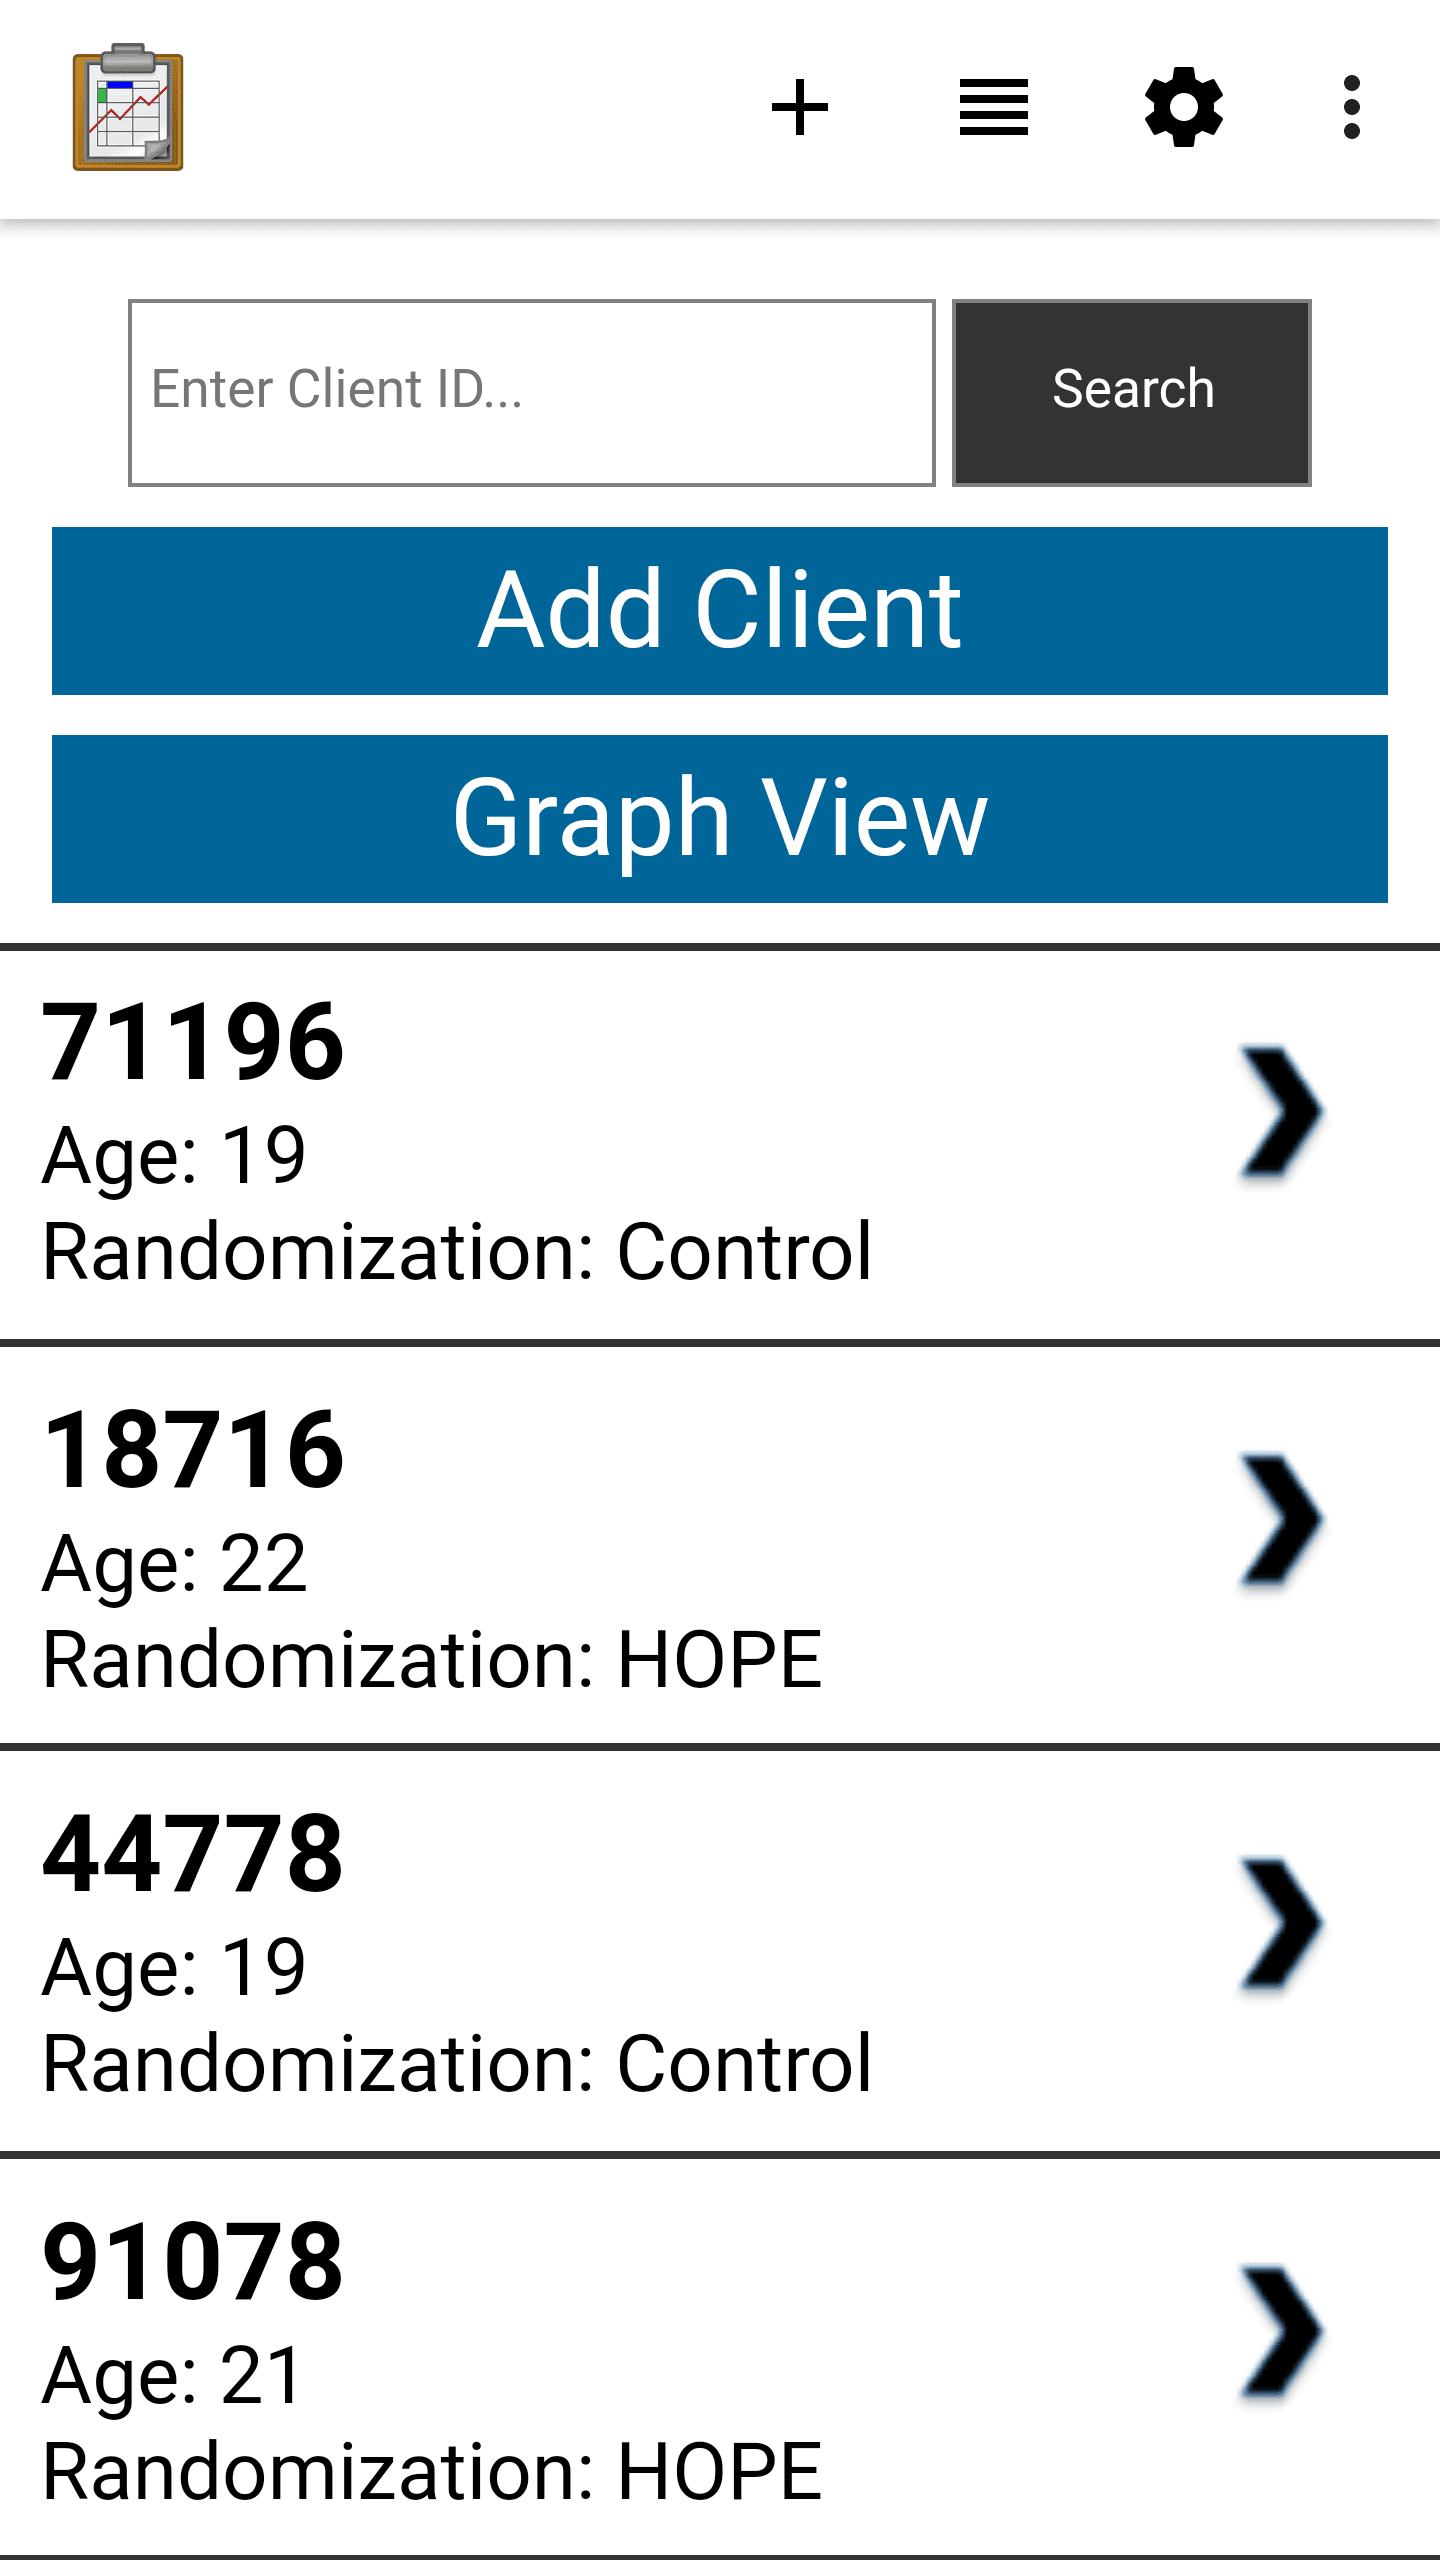
Often the items in a List View are clickable to launch a Detail View, a Detail With Sublist View, or a Custom View to display details of that item. Sometimes these views can also be viewed as Map Views and Navigation Views. See Changing View Types: The Lined Paper Button for instructions on how to find if these view options are available.
Detail View
Detail View is a customizable view that will change based on your Data Management Application's code. In general, it is used to render the data from a single record in a logical fashion.
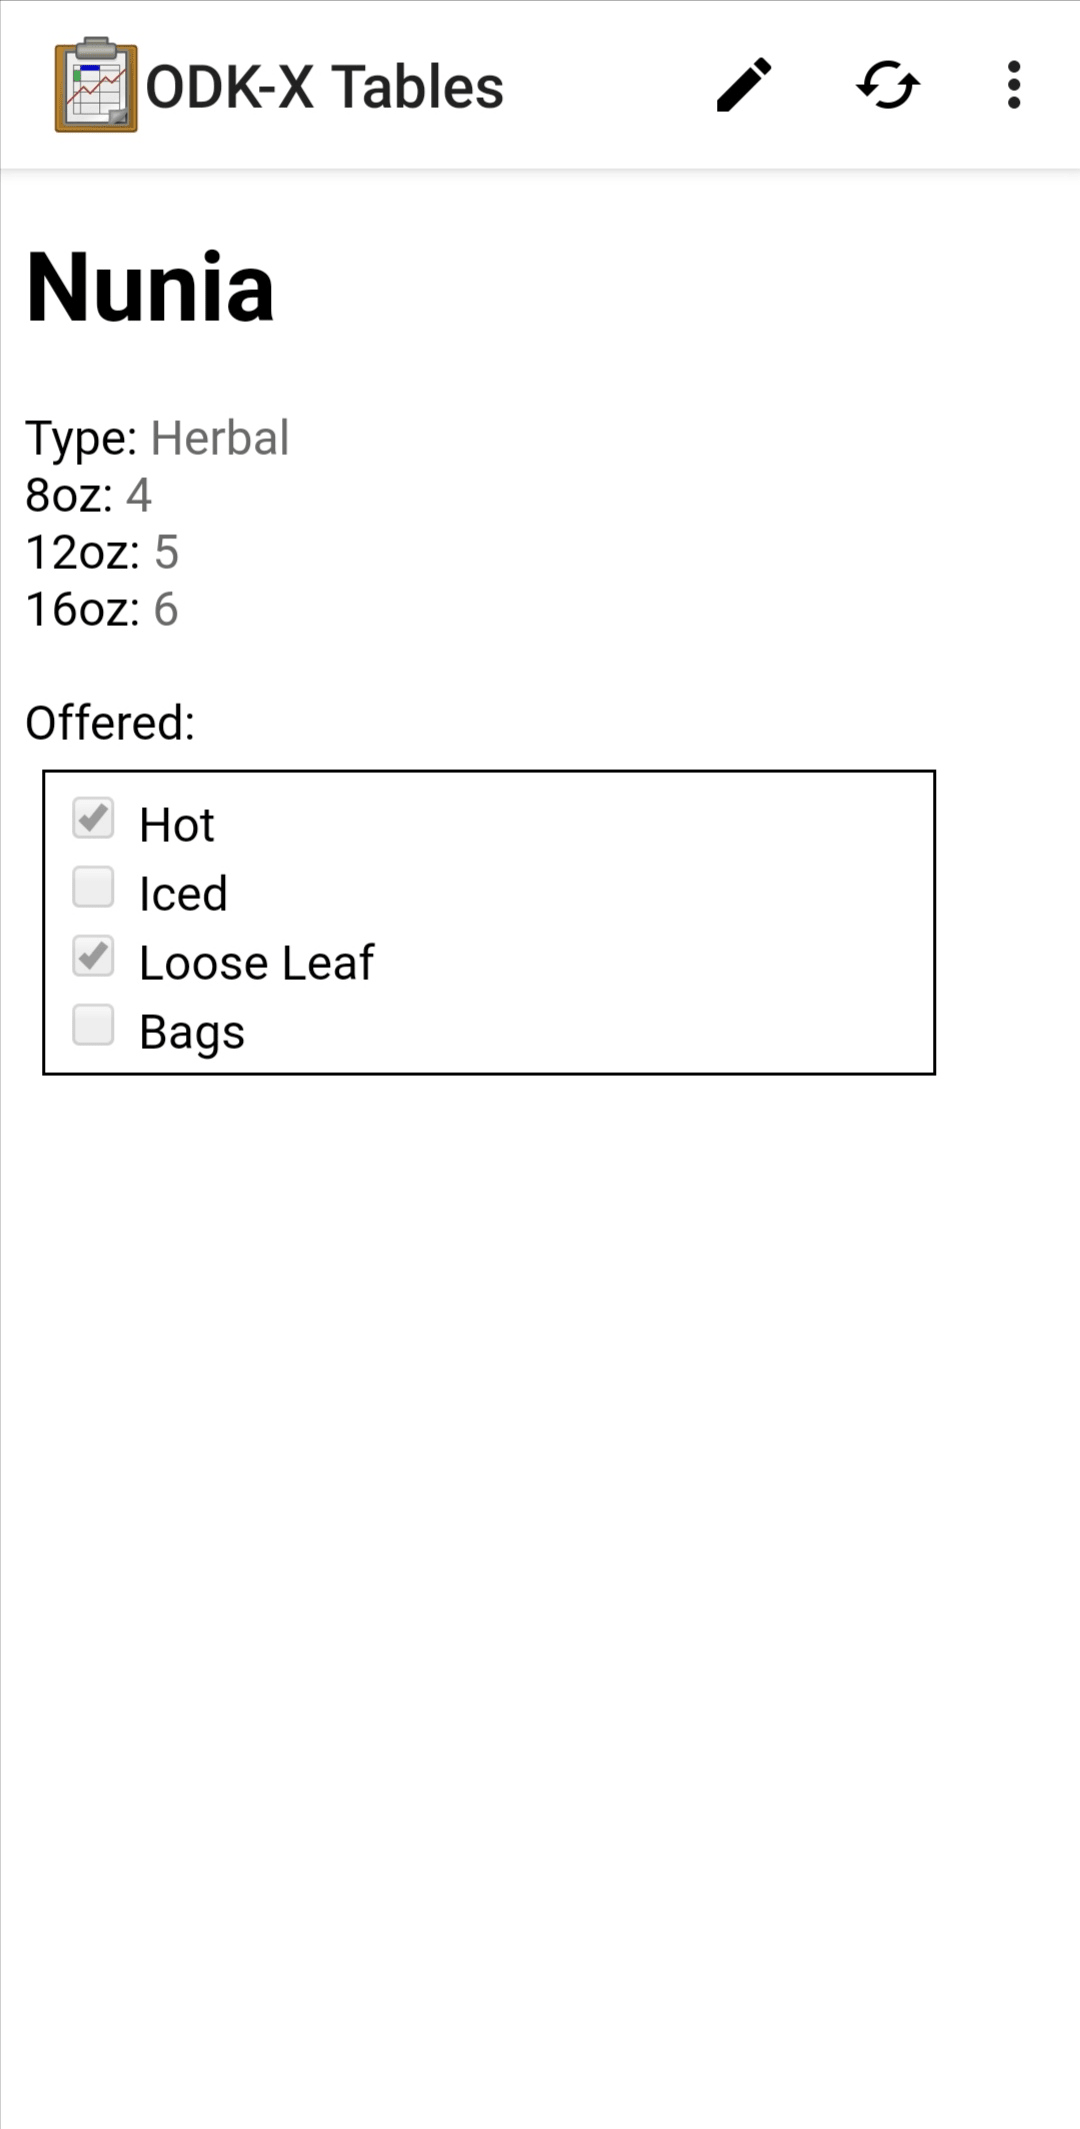
A Detail View may include some or all of the values from the record it is presenting, and it may include values drawn from other tables. The interface used to present that data is completely customized by the organization writing the Data Management Application.
This view is often launched from a List View or a Map View.
Detail With Sublist View
Detail With Sublist View is a customizable view that will change based on your Data Management Application's code. It is a combination of a Detail View on the top half of the screen and a List View on the bottom half of the screen.
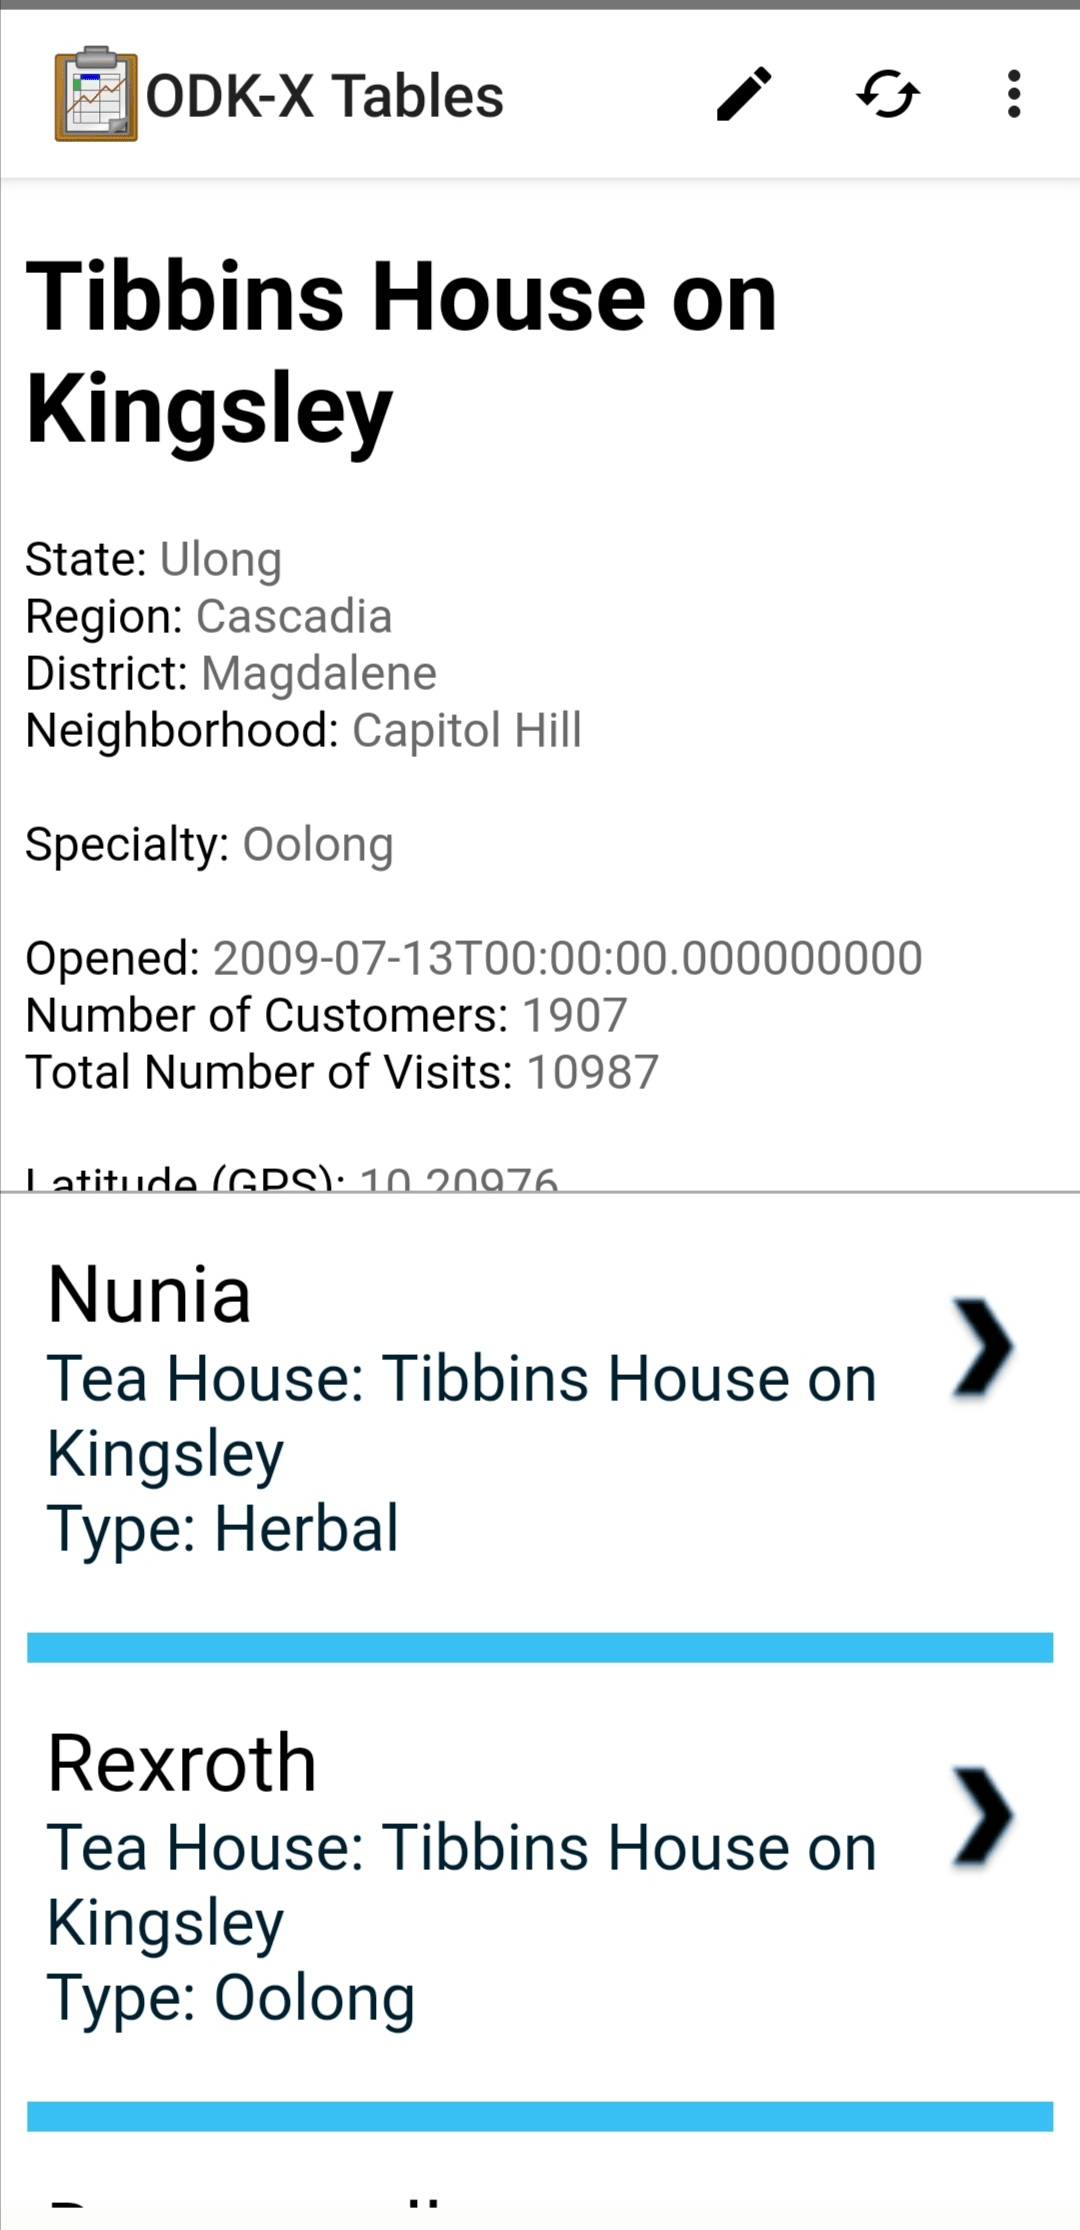
The Detail View on the top half of the screen follows all the same rules as a normal Detail View. In addition, it can control the List View rendered below it. There may be an interactive element within the Detail View that will cause the subordinate List View to redraw with different values.
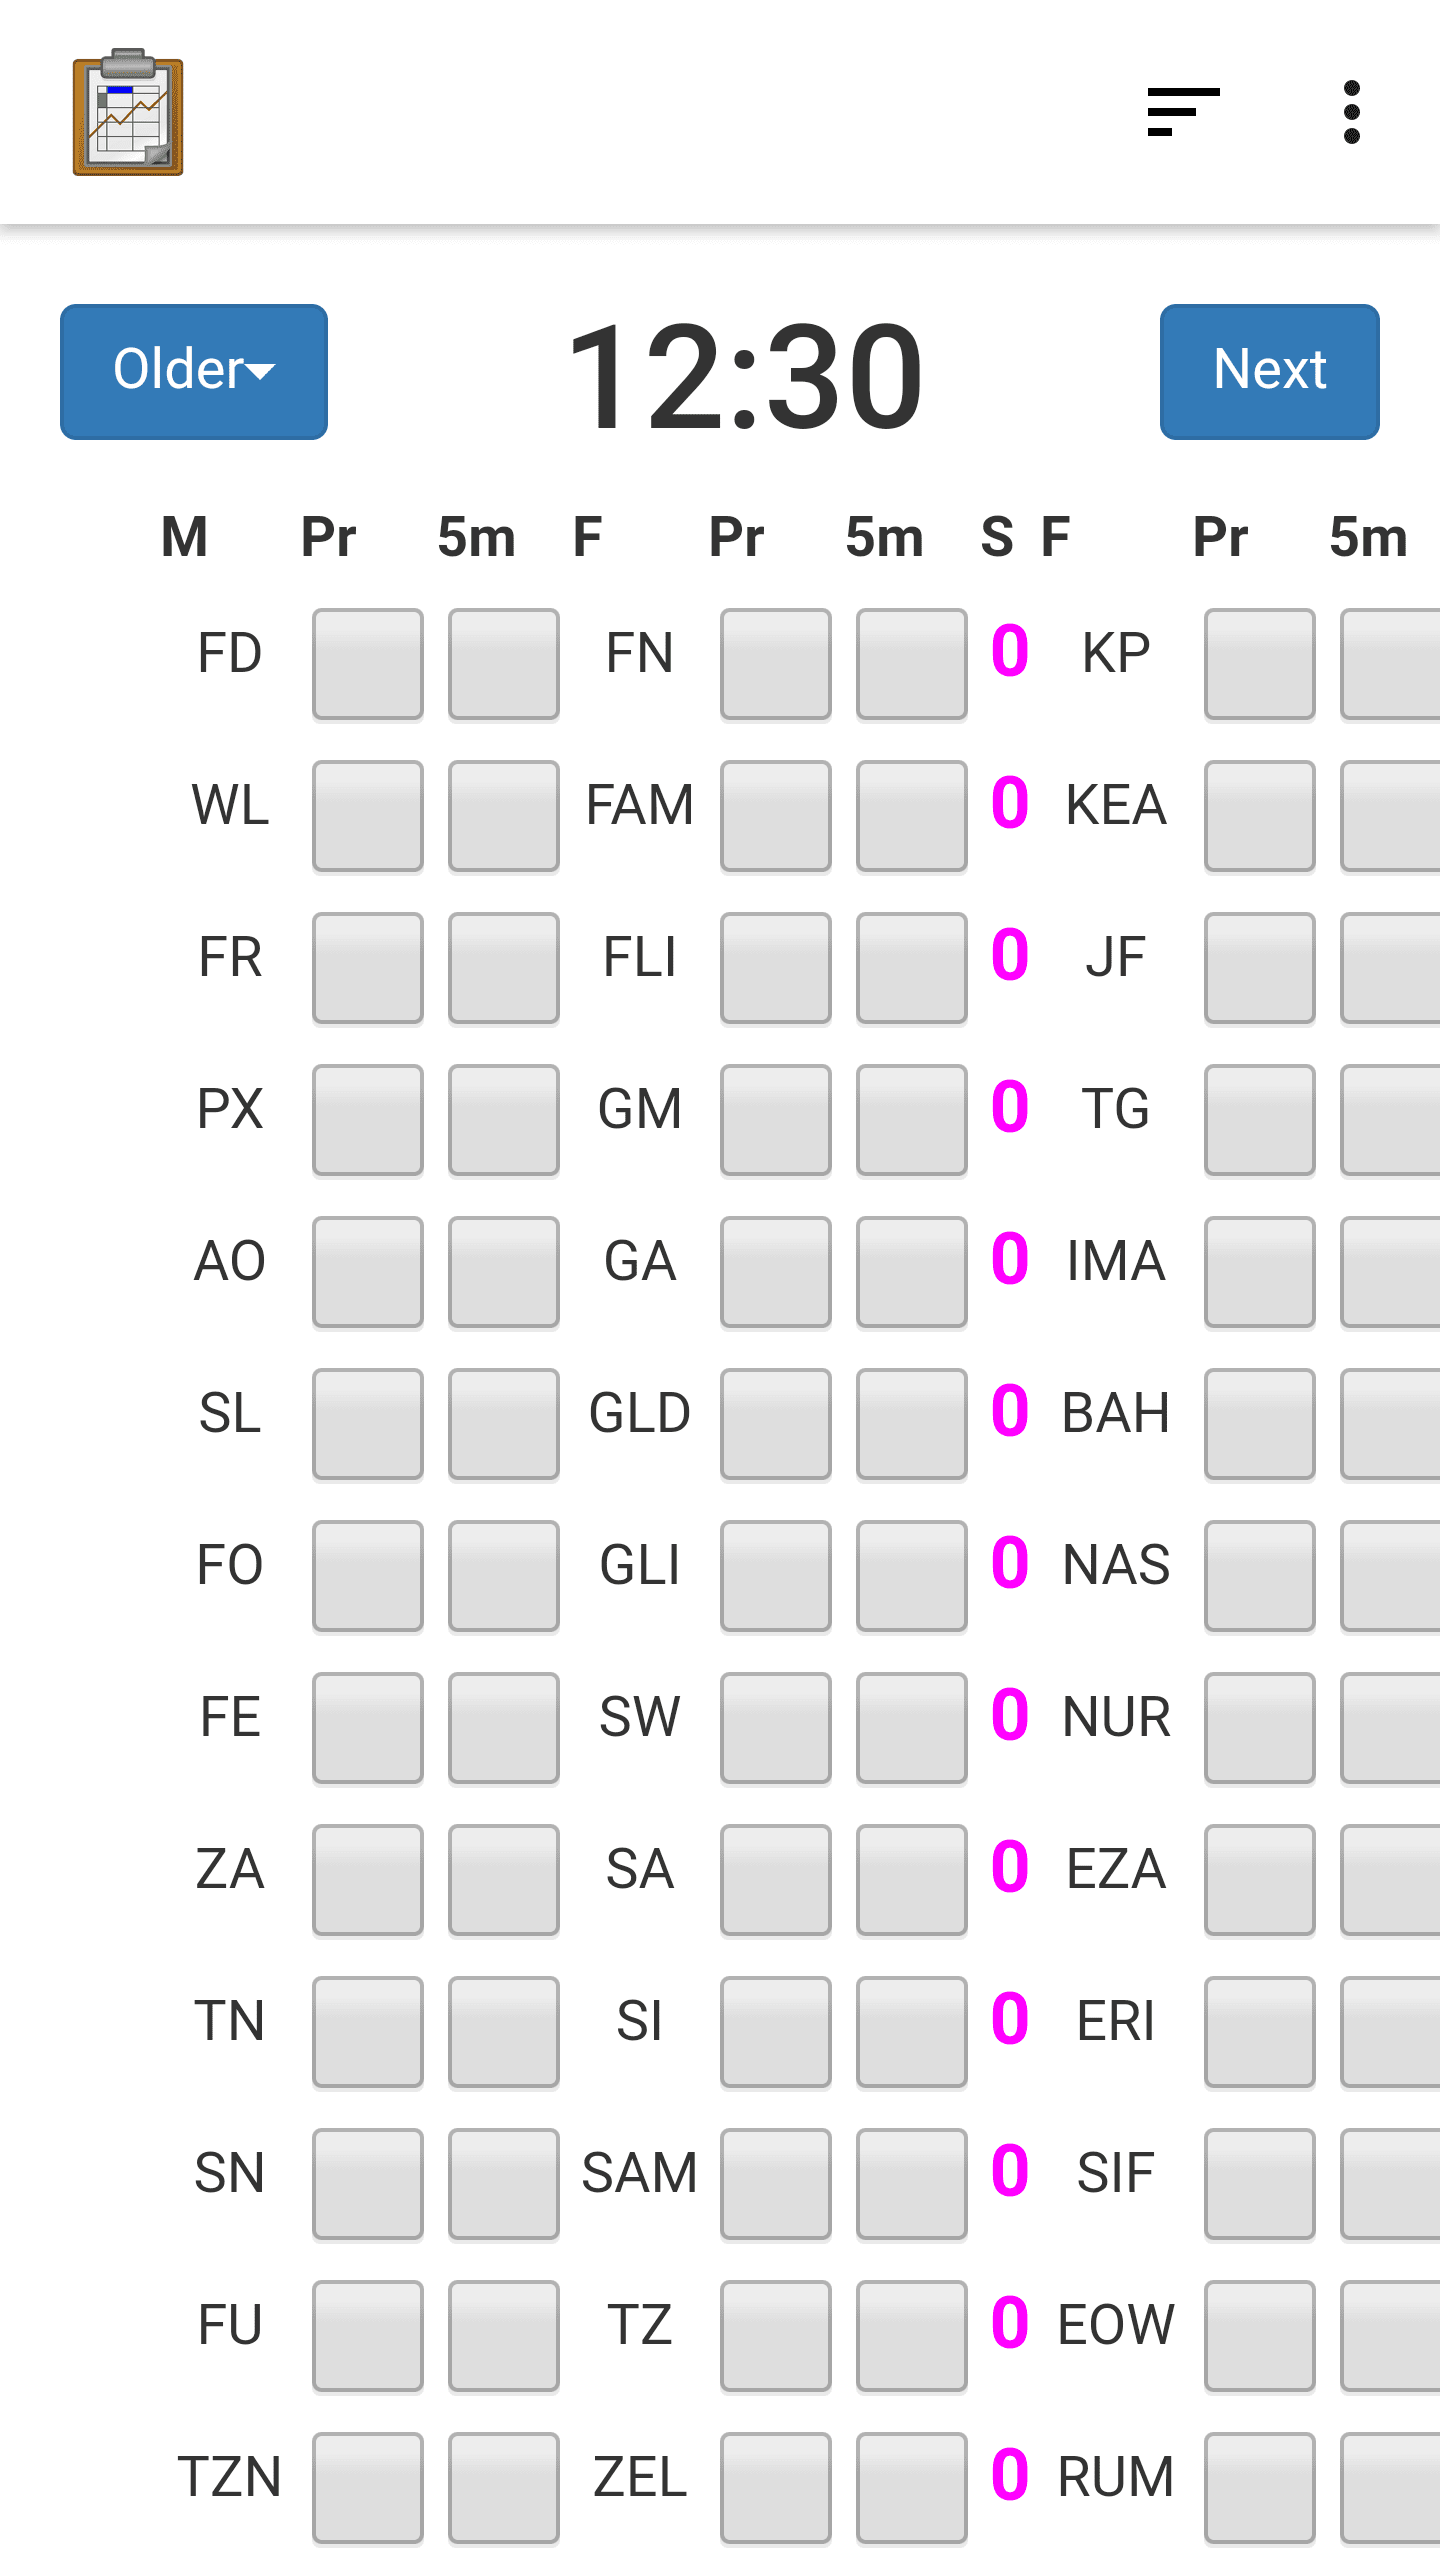
Graph View
Graph View is a customizable view that will change based on your Data Management Application's code. In general, it is a often specialized List View that creates a graphical rendering of the data (such as a bar graph or pie chart). It may also be a specialized Detail View or Custom View.
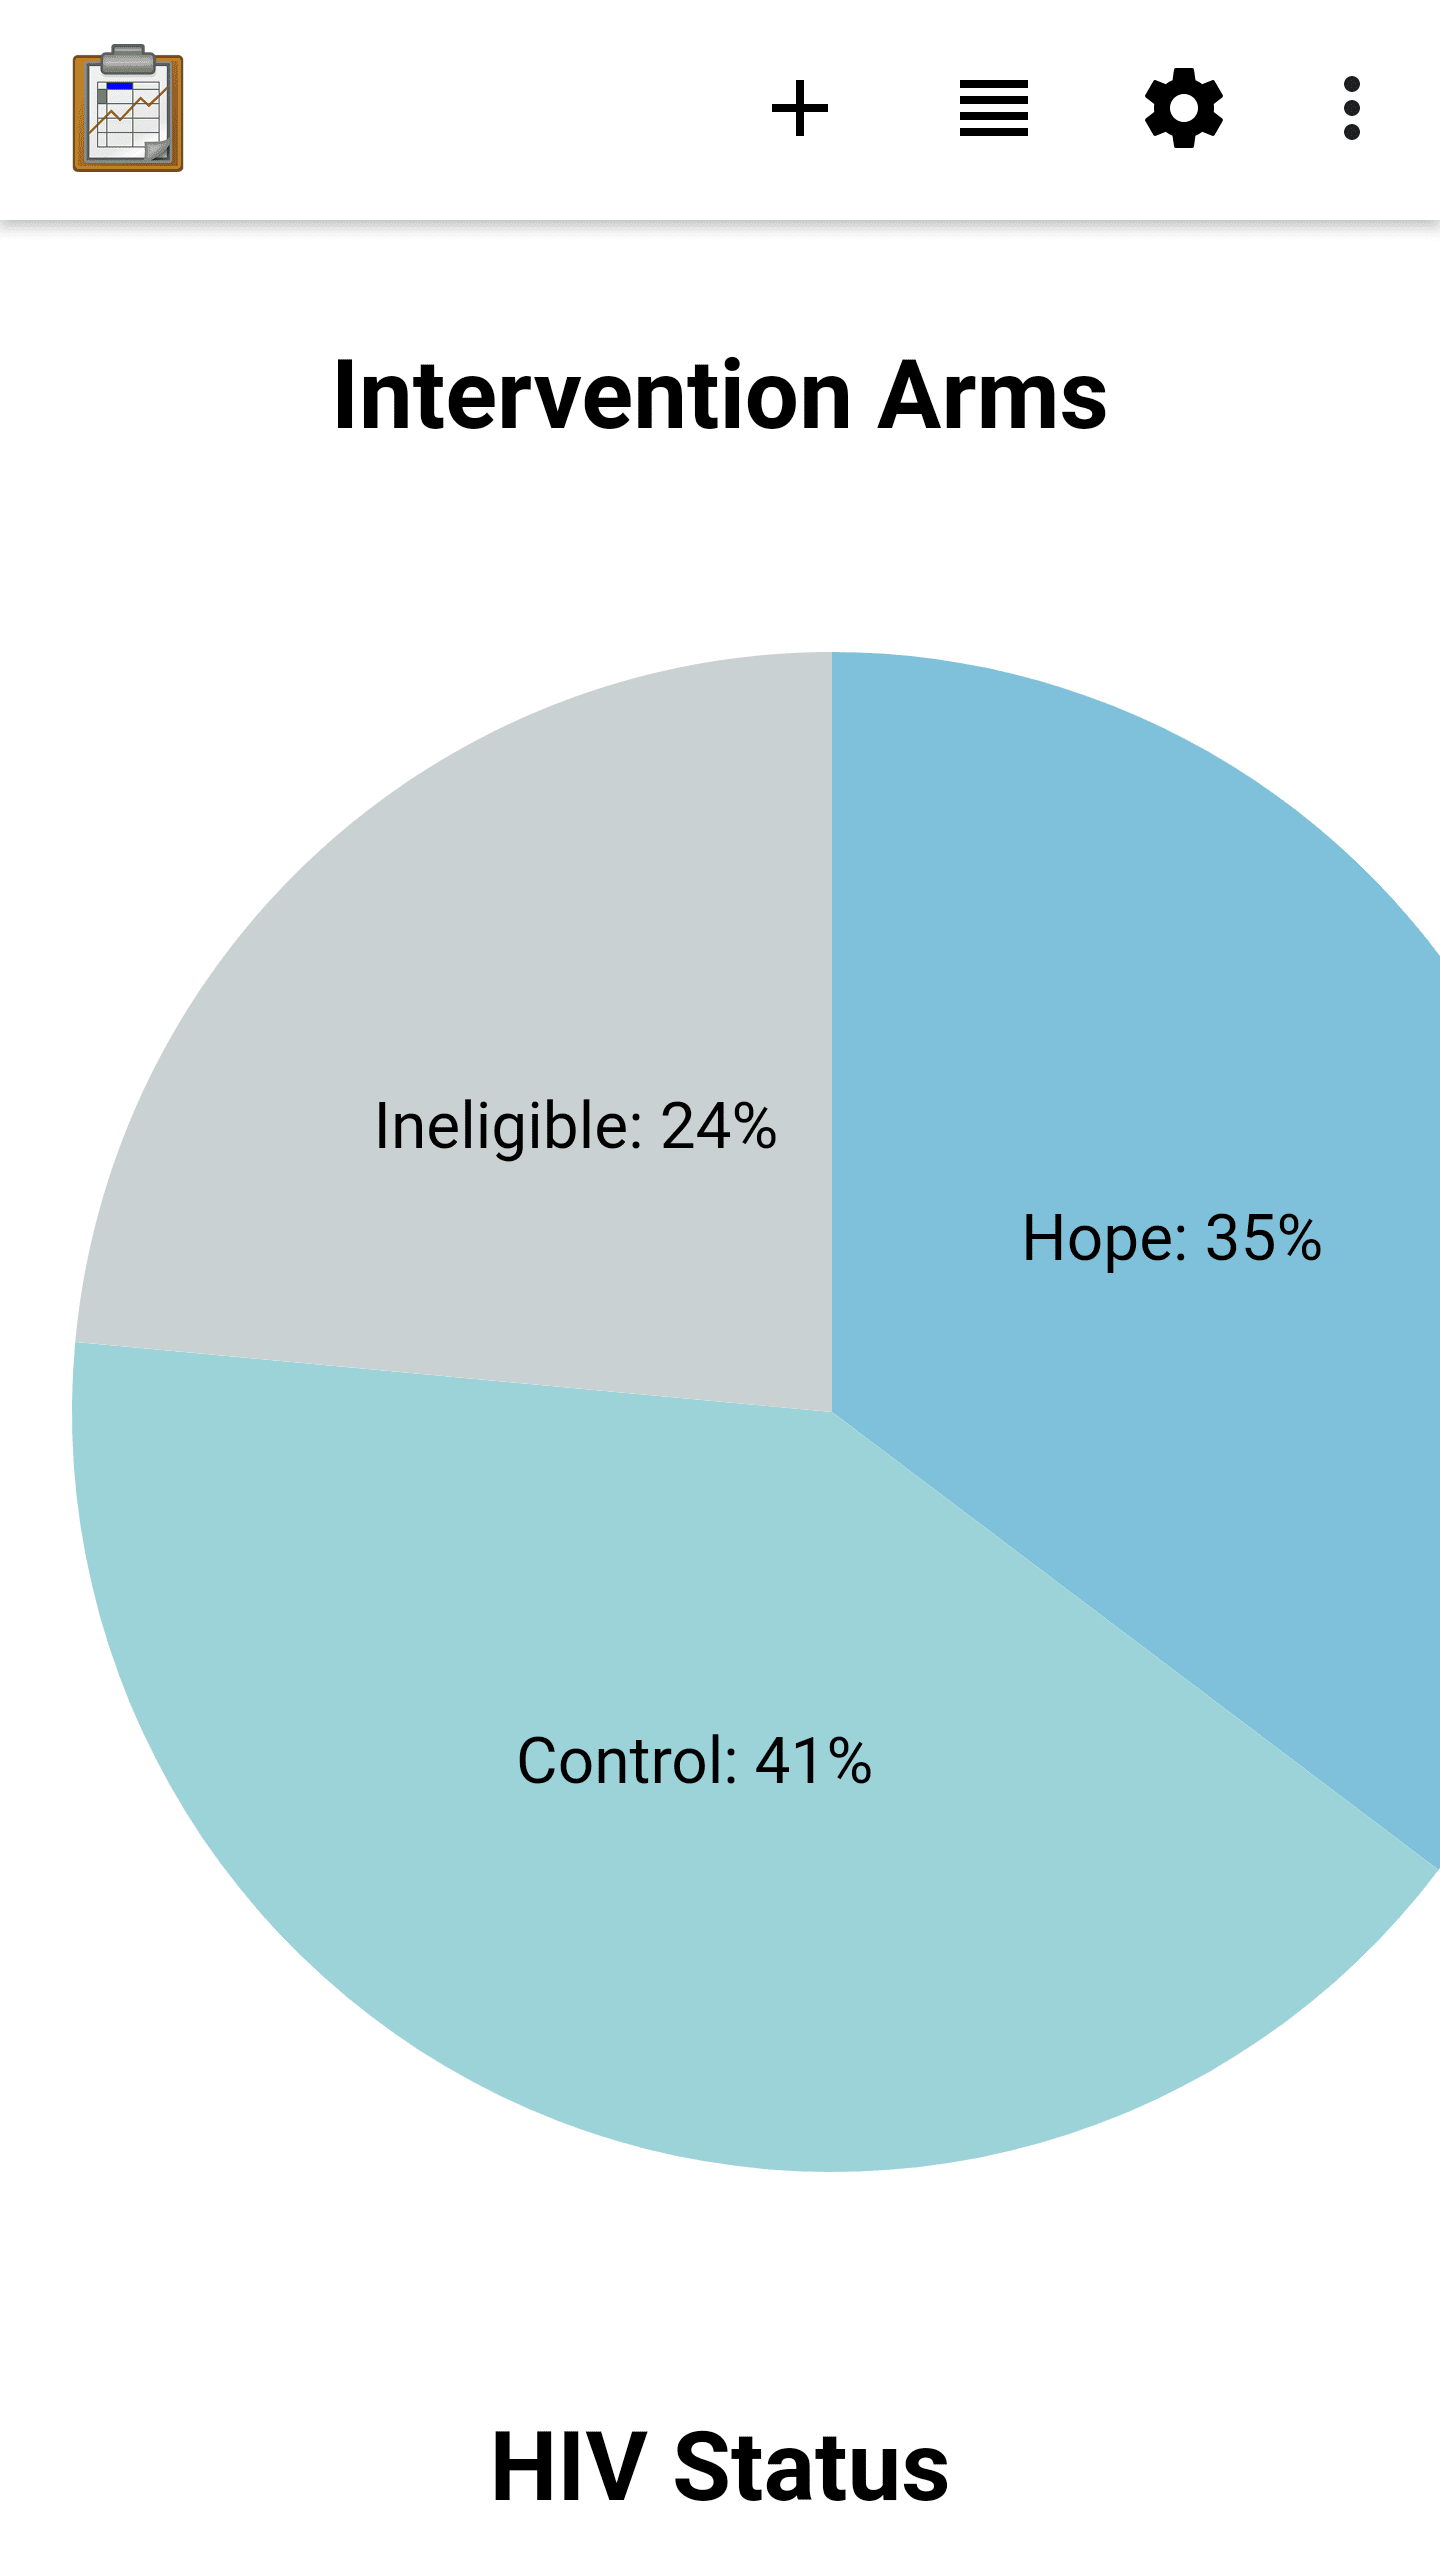
A Graph View uses JavaScript libraries such as D3 to create visualizations of collected data on the device. These will be rendered on demand using the data available, meaning that they will update and change as new data is collected.
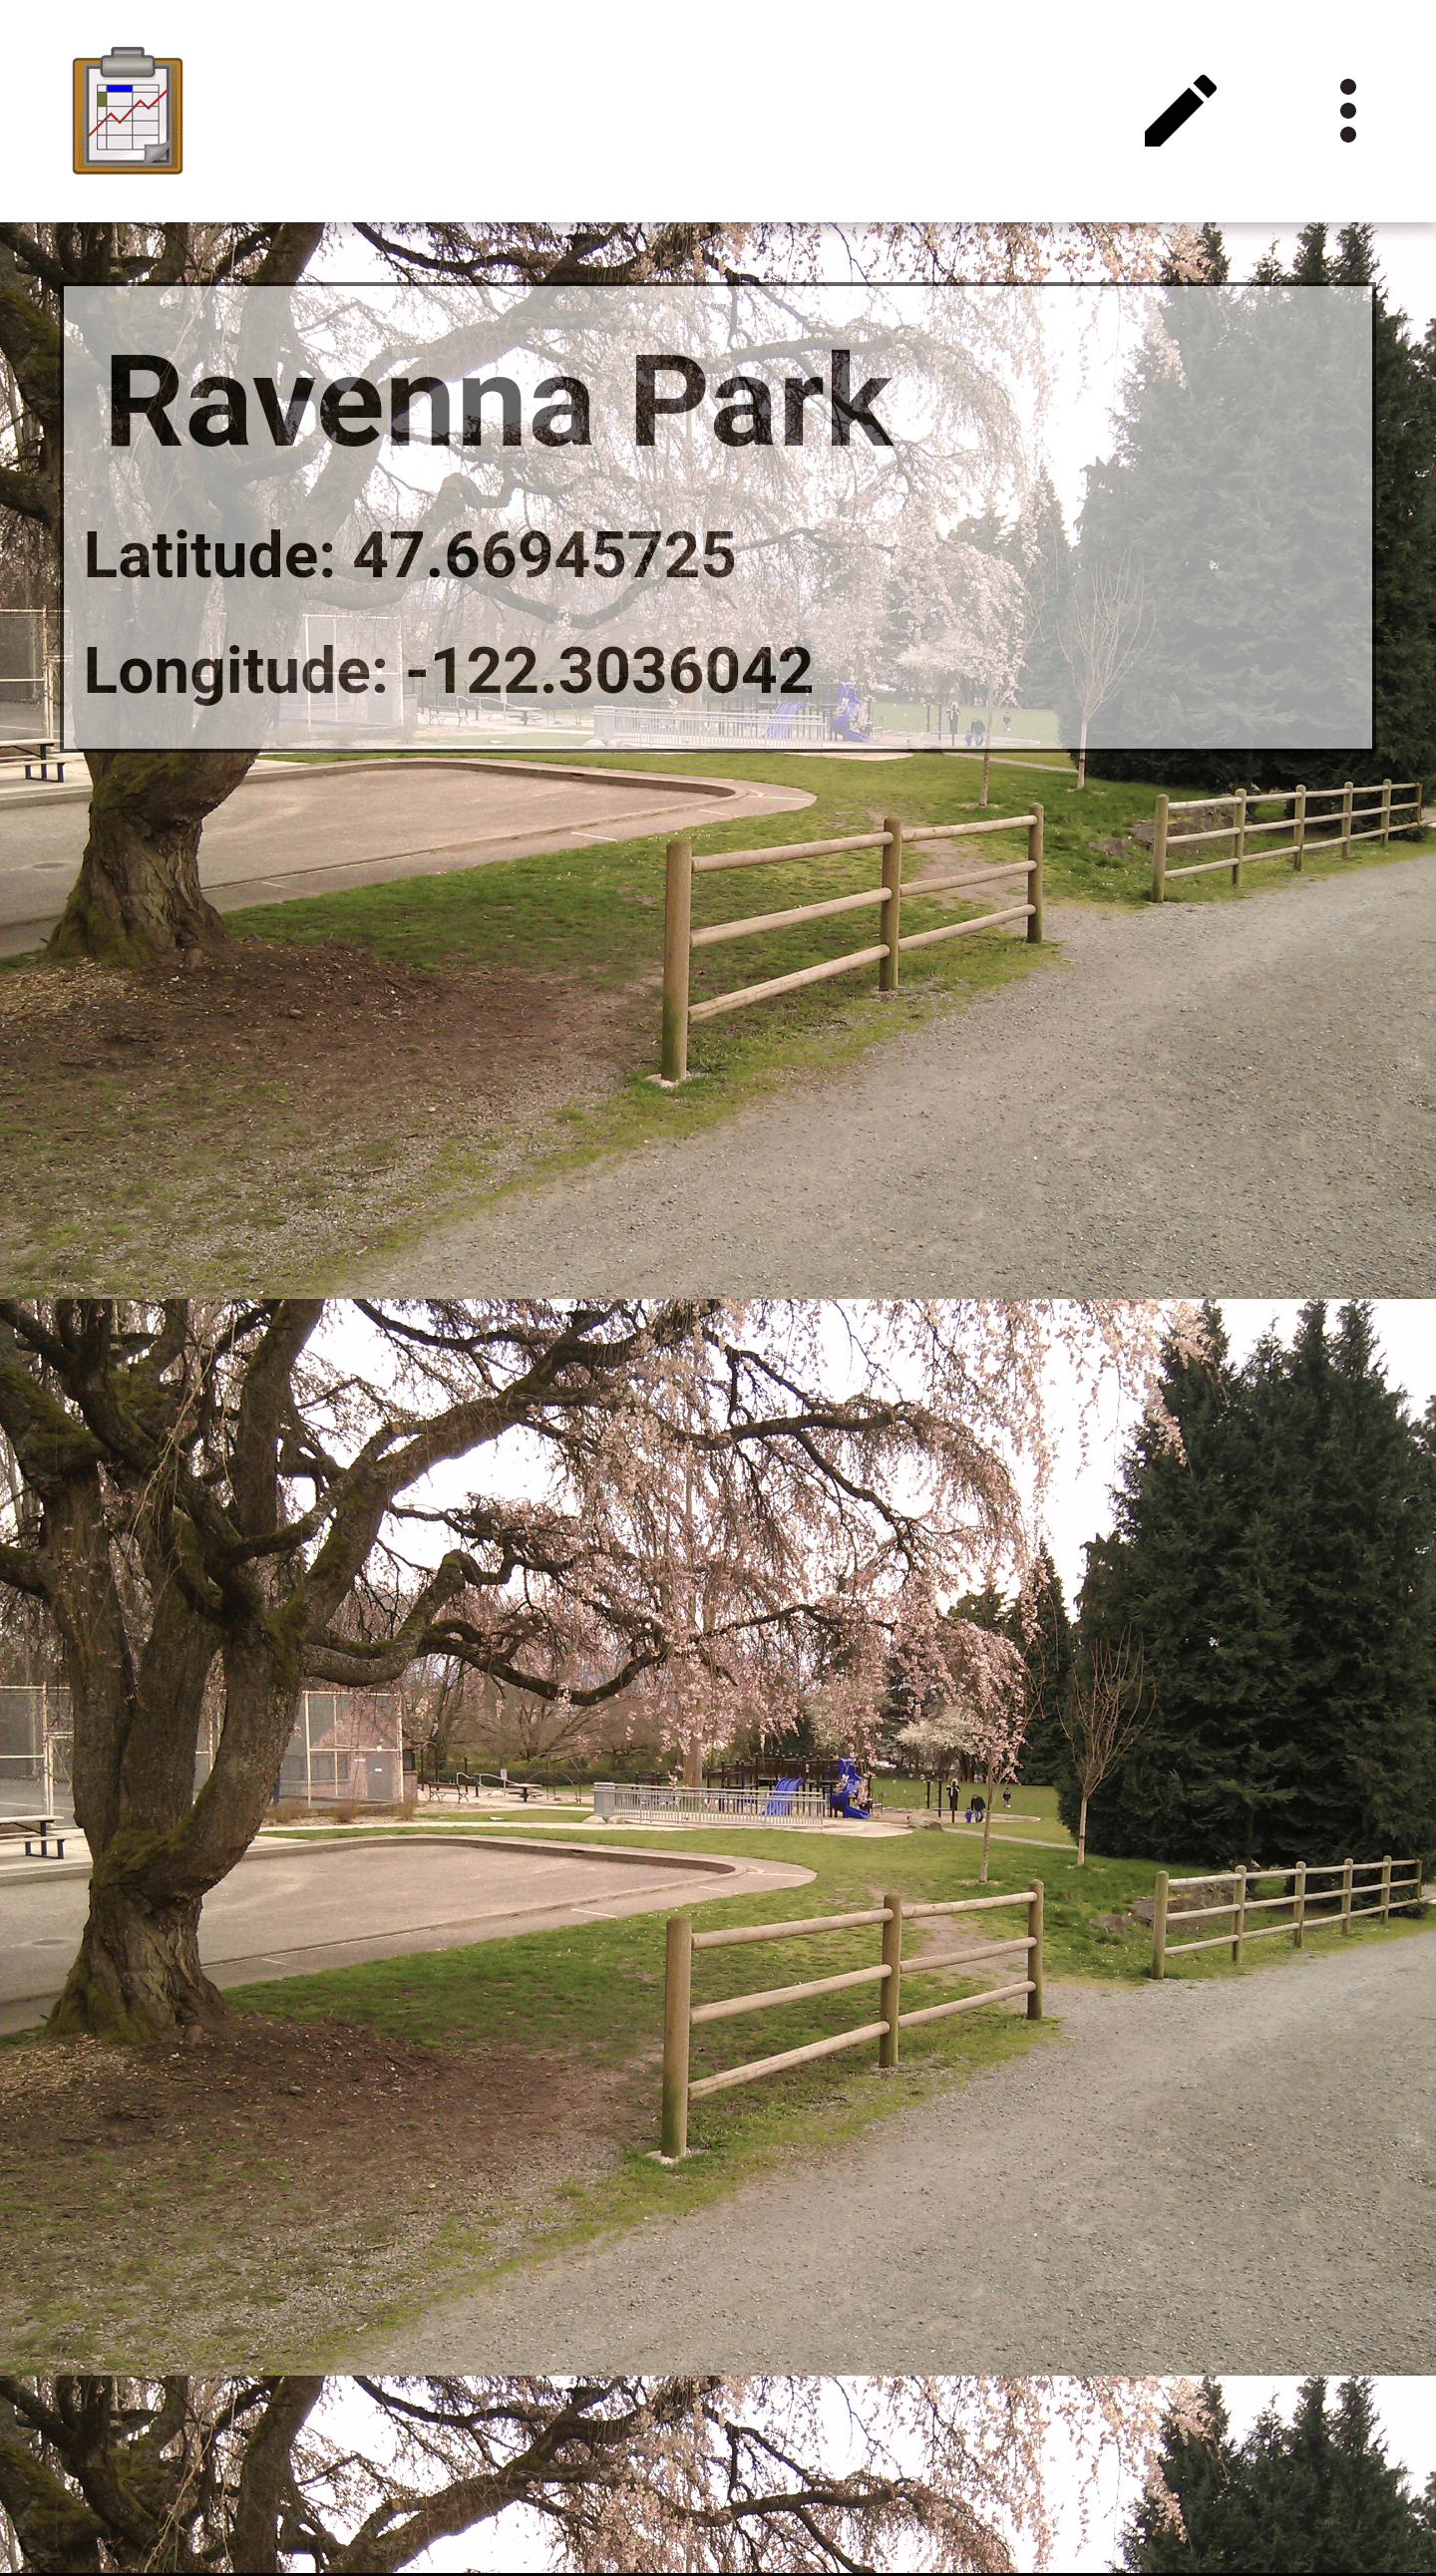
Map View
Map View is a partially customizable view that will change based on your Data Management Application's code. The top portion of the view is a List View representing the records in the data table, and the bottom portion of the screen renders the records as geopoints on a map using Google Maps.
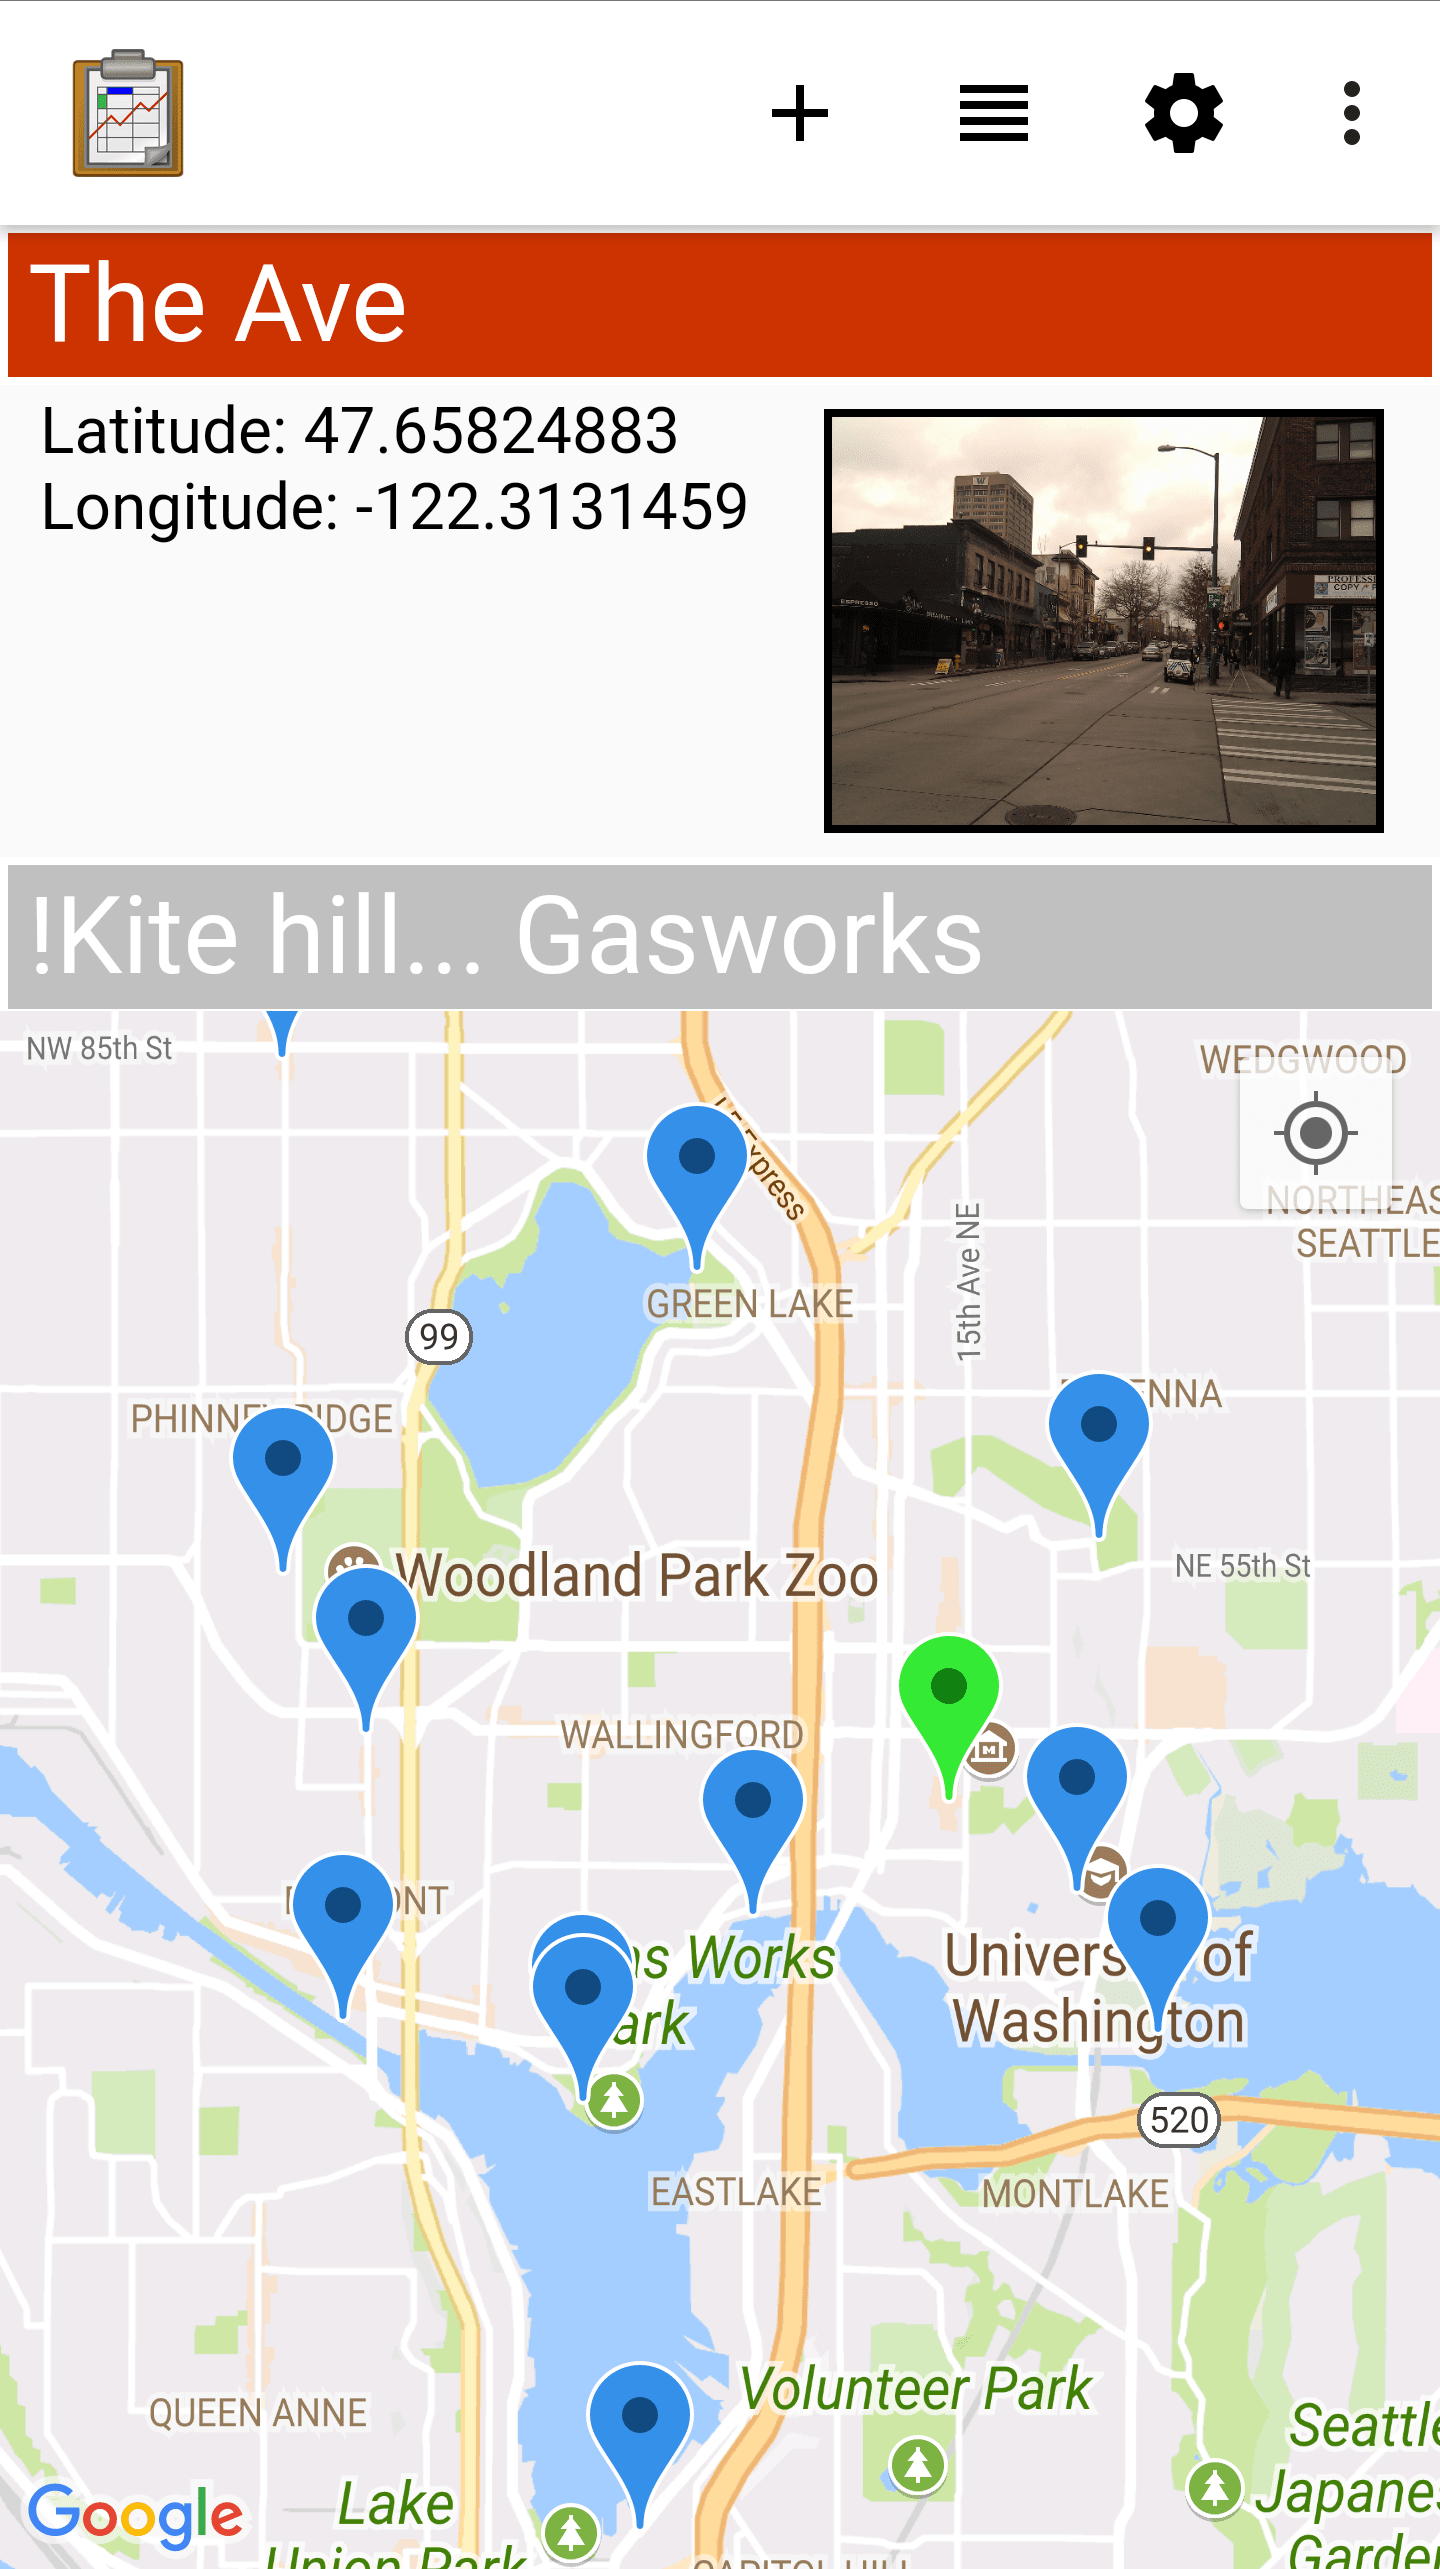
Points are added to the map based on their recorded latitude and longitude values. The map can be navigated by pinching or widening to zoom in and out, or swipe around to move the window (the same controls as the stand alone Google Maps).
When a point is selected in a Map View it will usually update the List View on the top portion of the screen to select the same point, and possibly present more data about that point.
Navigate View
Navigate View is similar to Map View, but the top portion is replaced with navigational tools to aid in finding a location on the map in the real world. The bottom portion of the screen still renders the records as geopoints on a map using Google Maps.
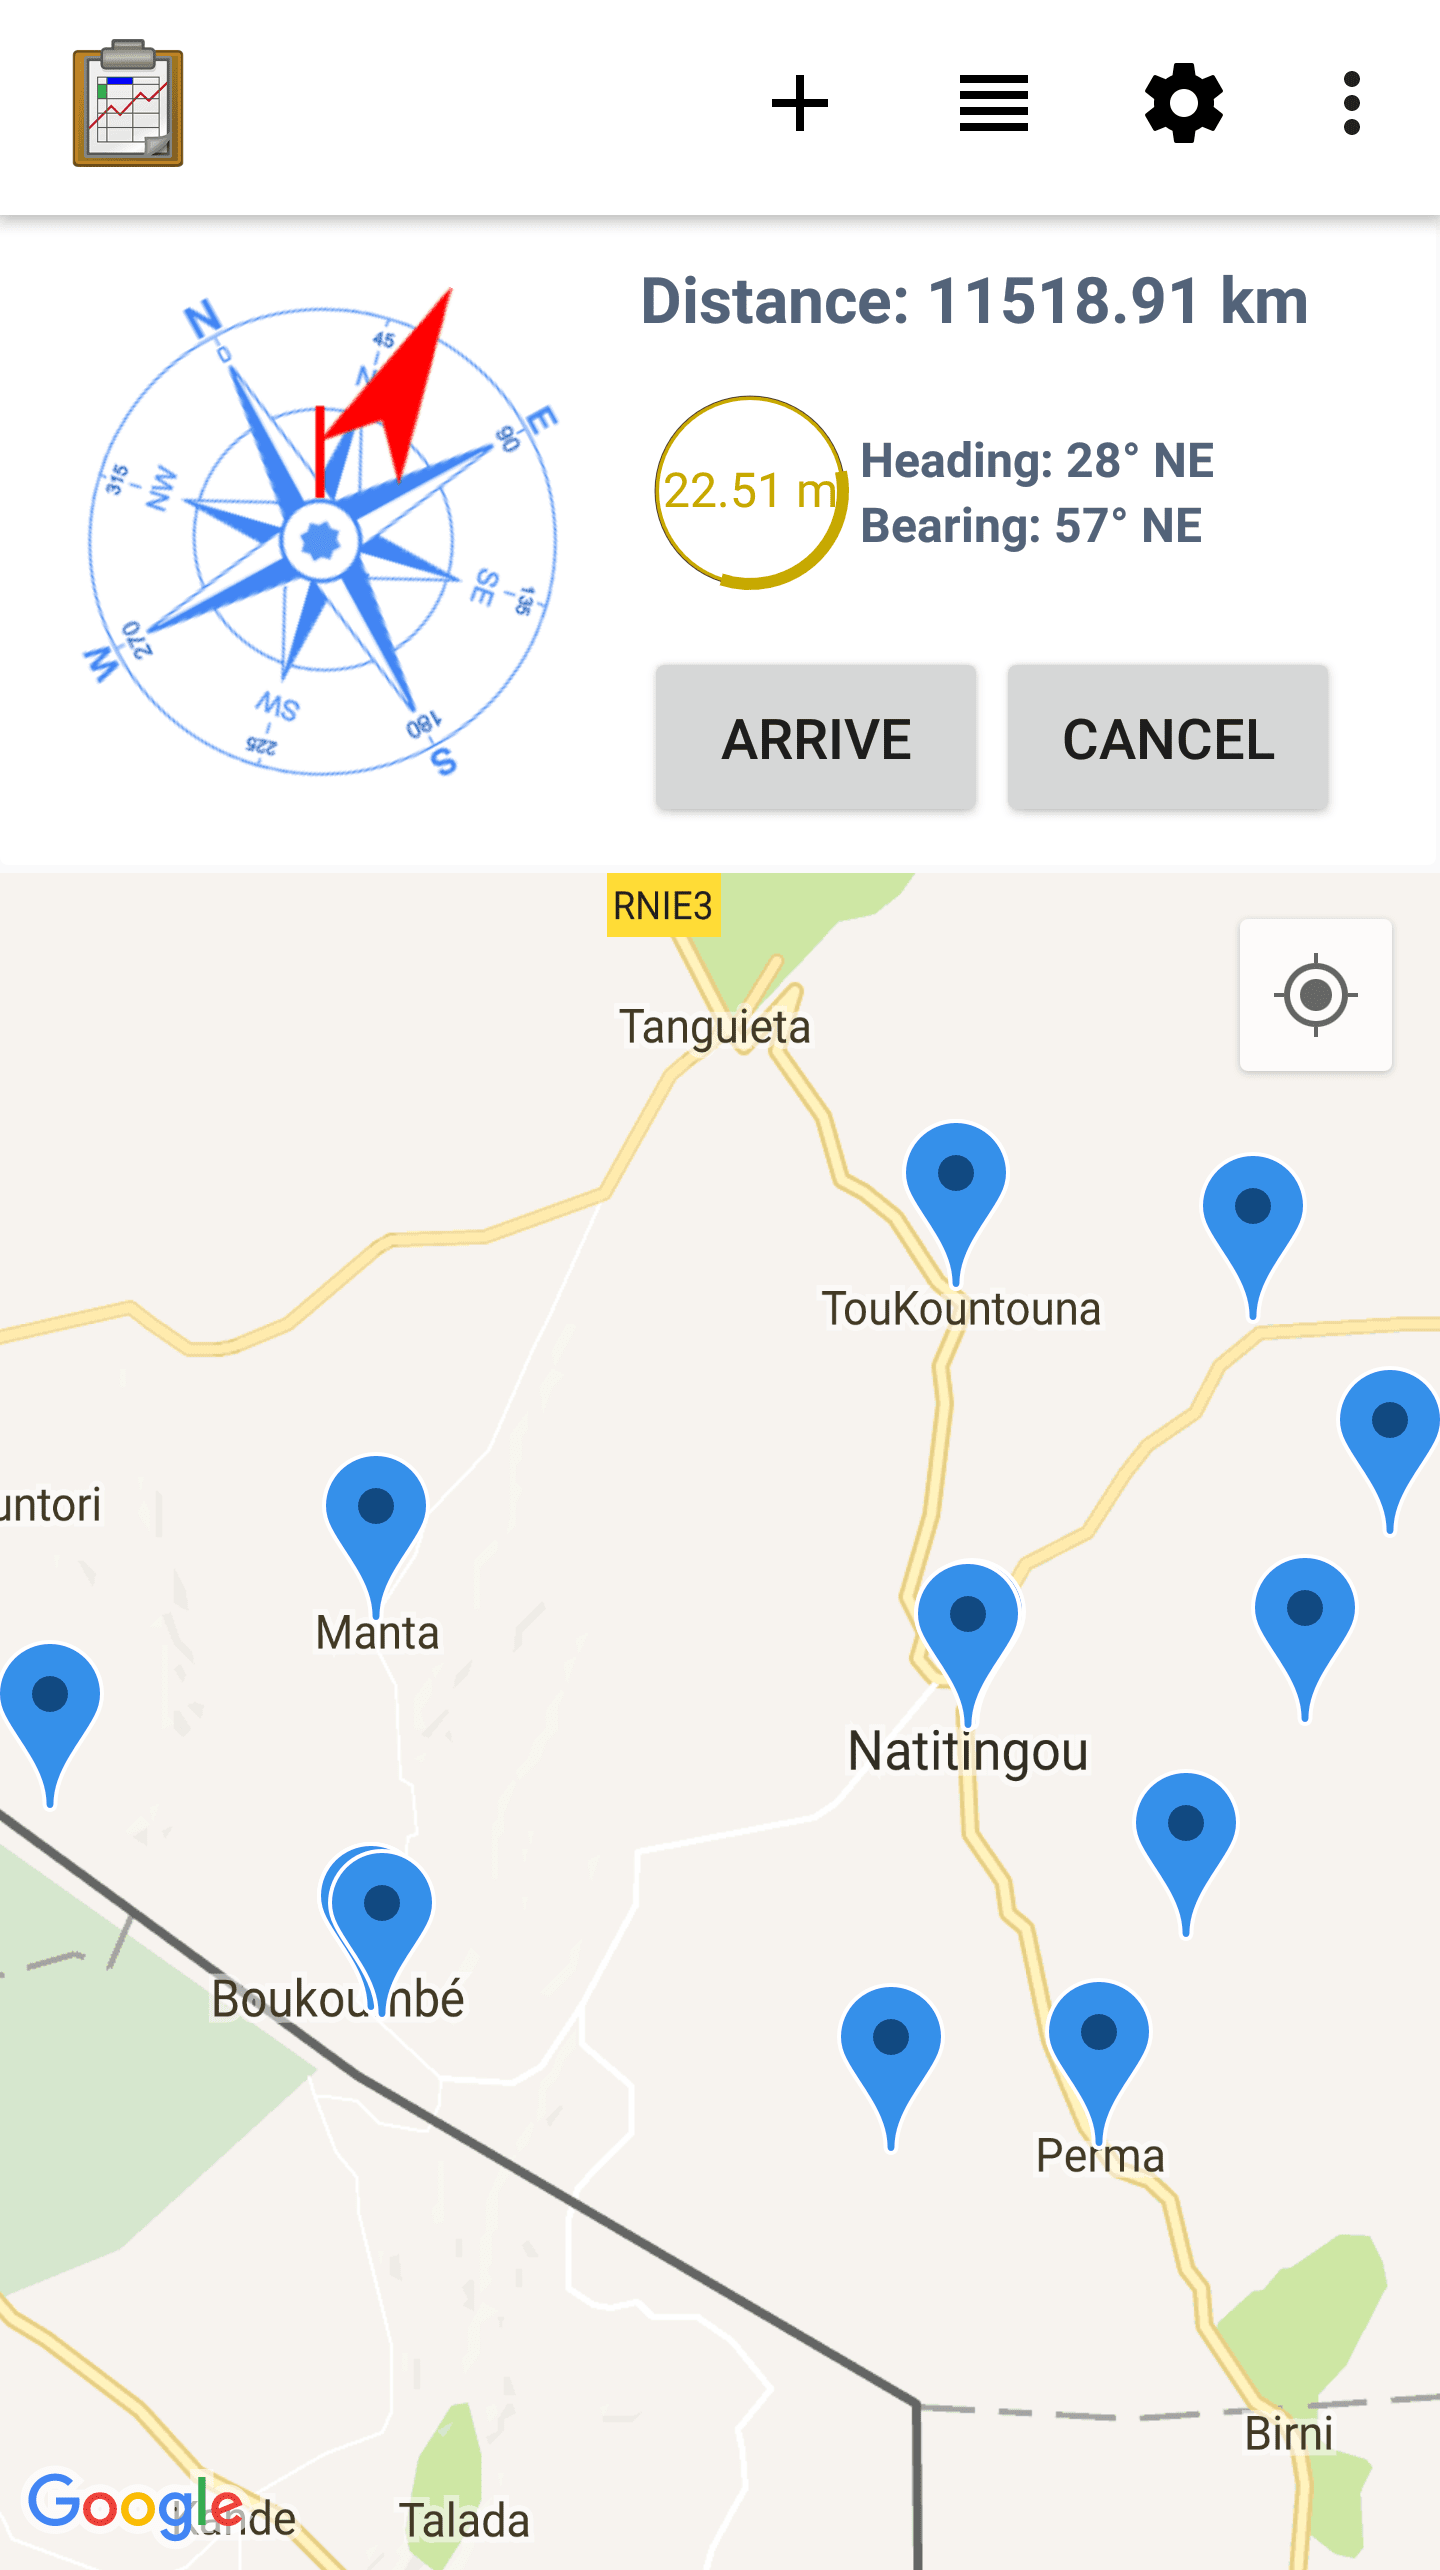
When a point on the map is selected, the navigation controls on the top portion of the screen will update to guide you to the selected point.
Compass shows you cardinal directions in addition to an arrow pointing at the navigation point.
Distance shows the distance between your GPS location and the navigation point.
Heading shows the direction that you are facing.
Bearing shows the angle between your heading and your navigation point.
GPS Accuracy Spinner shows the GPS's current accuracy estimate. It will change color based on how good this accuracy is.
The Arrive button will return you to the screen that launched the Navigation View with a success code. This may launch a follow up Survey or workflow to be performed at the navigation point.
The Cancel button also returns you to the screen that launched the Navigation View, but with a failure code. It indicates that the navigation point was not reached and it will not trigger a follow up workflow.
Custom View
Custom View is a completely customized view that is defined by your Data Management Application's code. There is no general pattern for Custom Views.
Custom Views are arbitrary user interfaces built on top of web technologies and rendered in Tables. They can be anything your organization needs to implement its custom workflow.
Note
Custom Views are not limited to displaying data. They can also be used to collect or modify data. See the guide for editing data with custom views.
Changing View Types: The Lined Paper Button
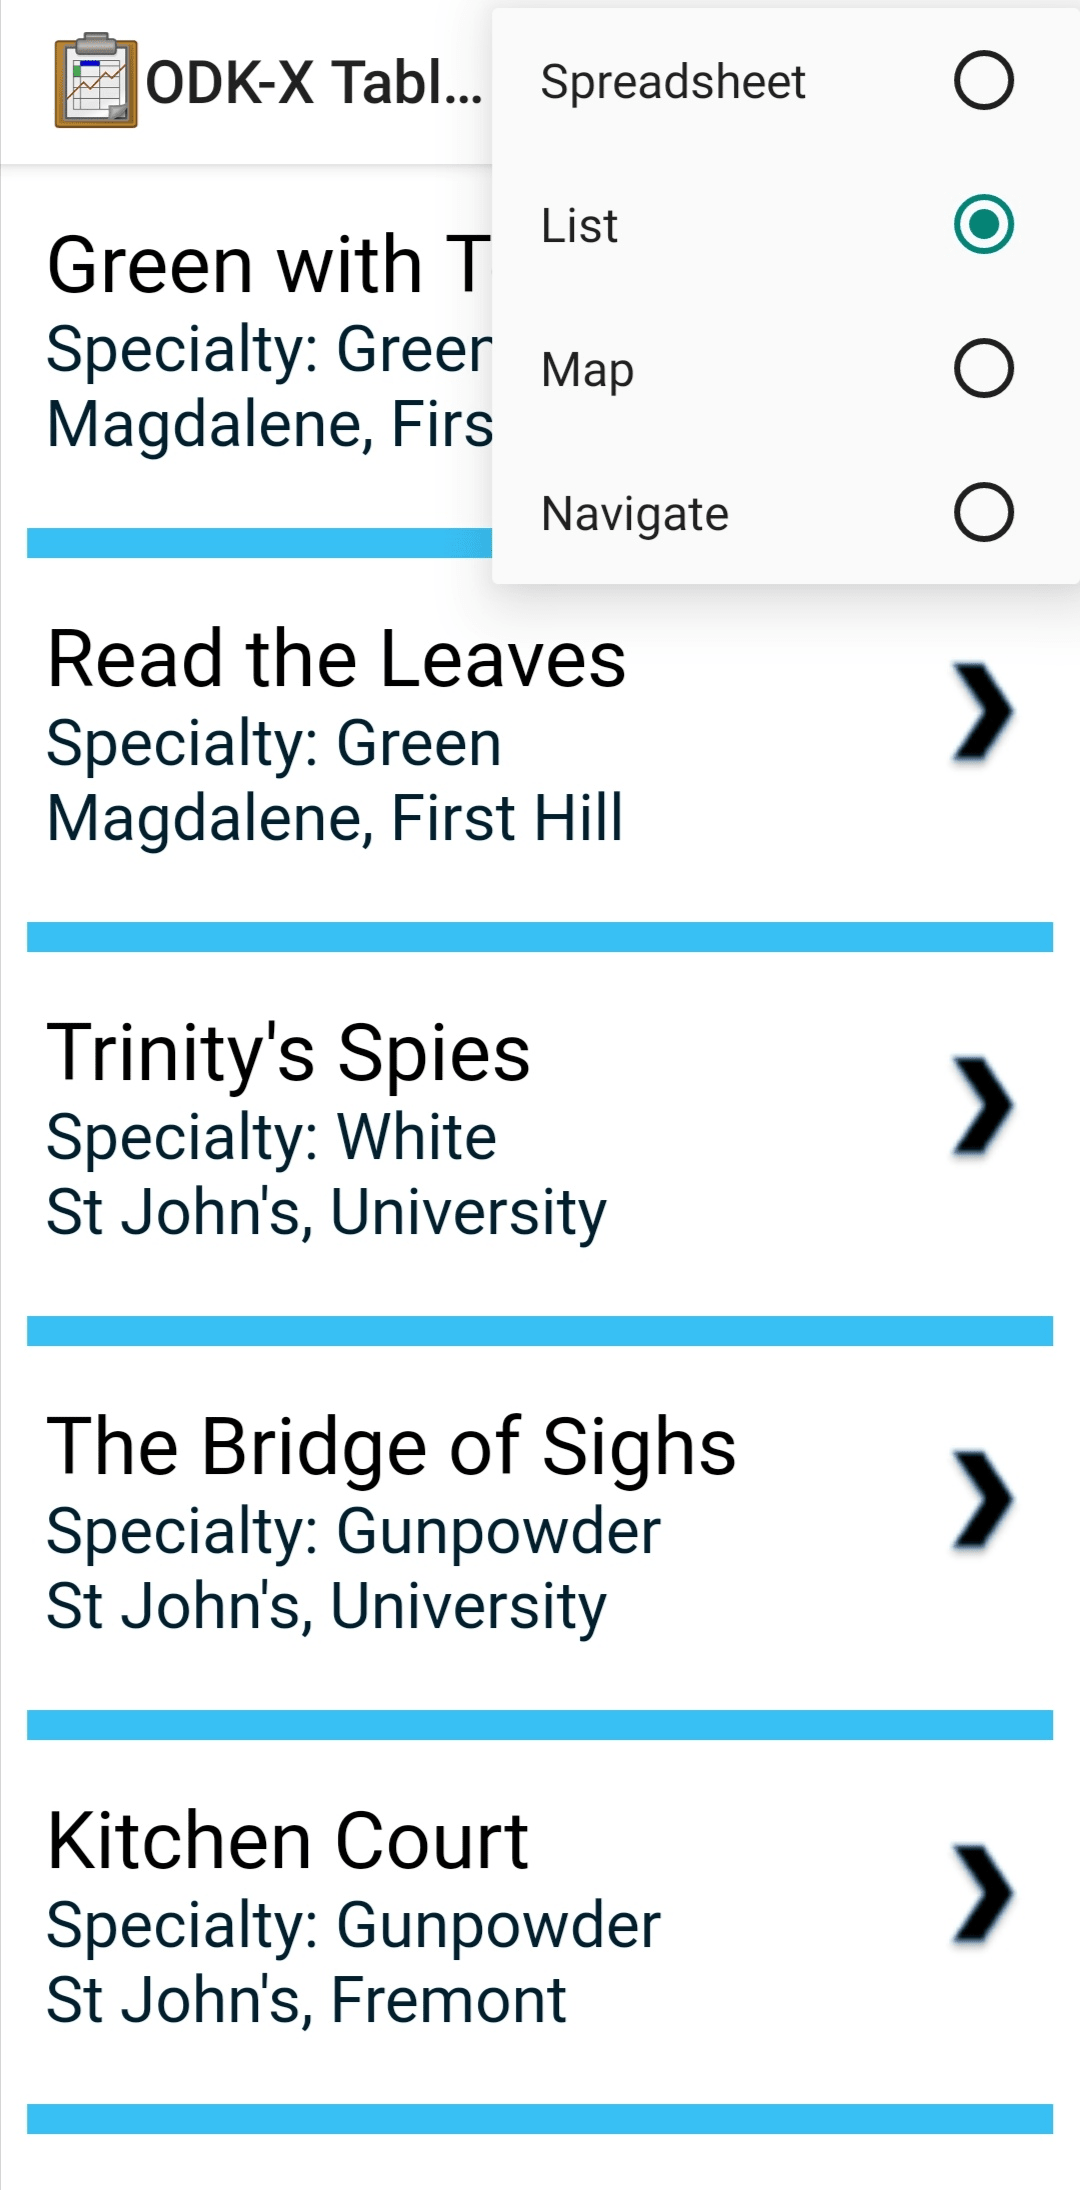
The view types that represent multiple records (Spreadsheet View, List View, Map View, Navigate View) can be alternately chosen, depending on what was configured in the table's settings.
To change to another view type, tap the lined paper icon from the upper right:
This will bring up a menu that lets you select your desired alternate view type.
Tip
Graph View is a special case. You may have the lined paper icon available to you, but it may only have Spreadsheet View as its alternative option, and may not have an option to return to the Graph View. Usually pressing the back button from Spreadsheet View will return you to the Graph View.
Graph Views also may not have the lined paper icon available at all if they are instead mapped as a Detail View or a Custom View.
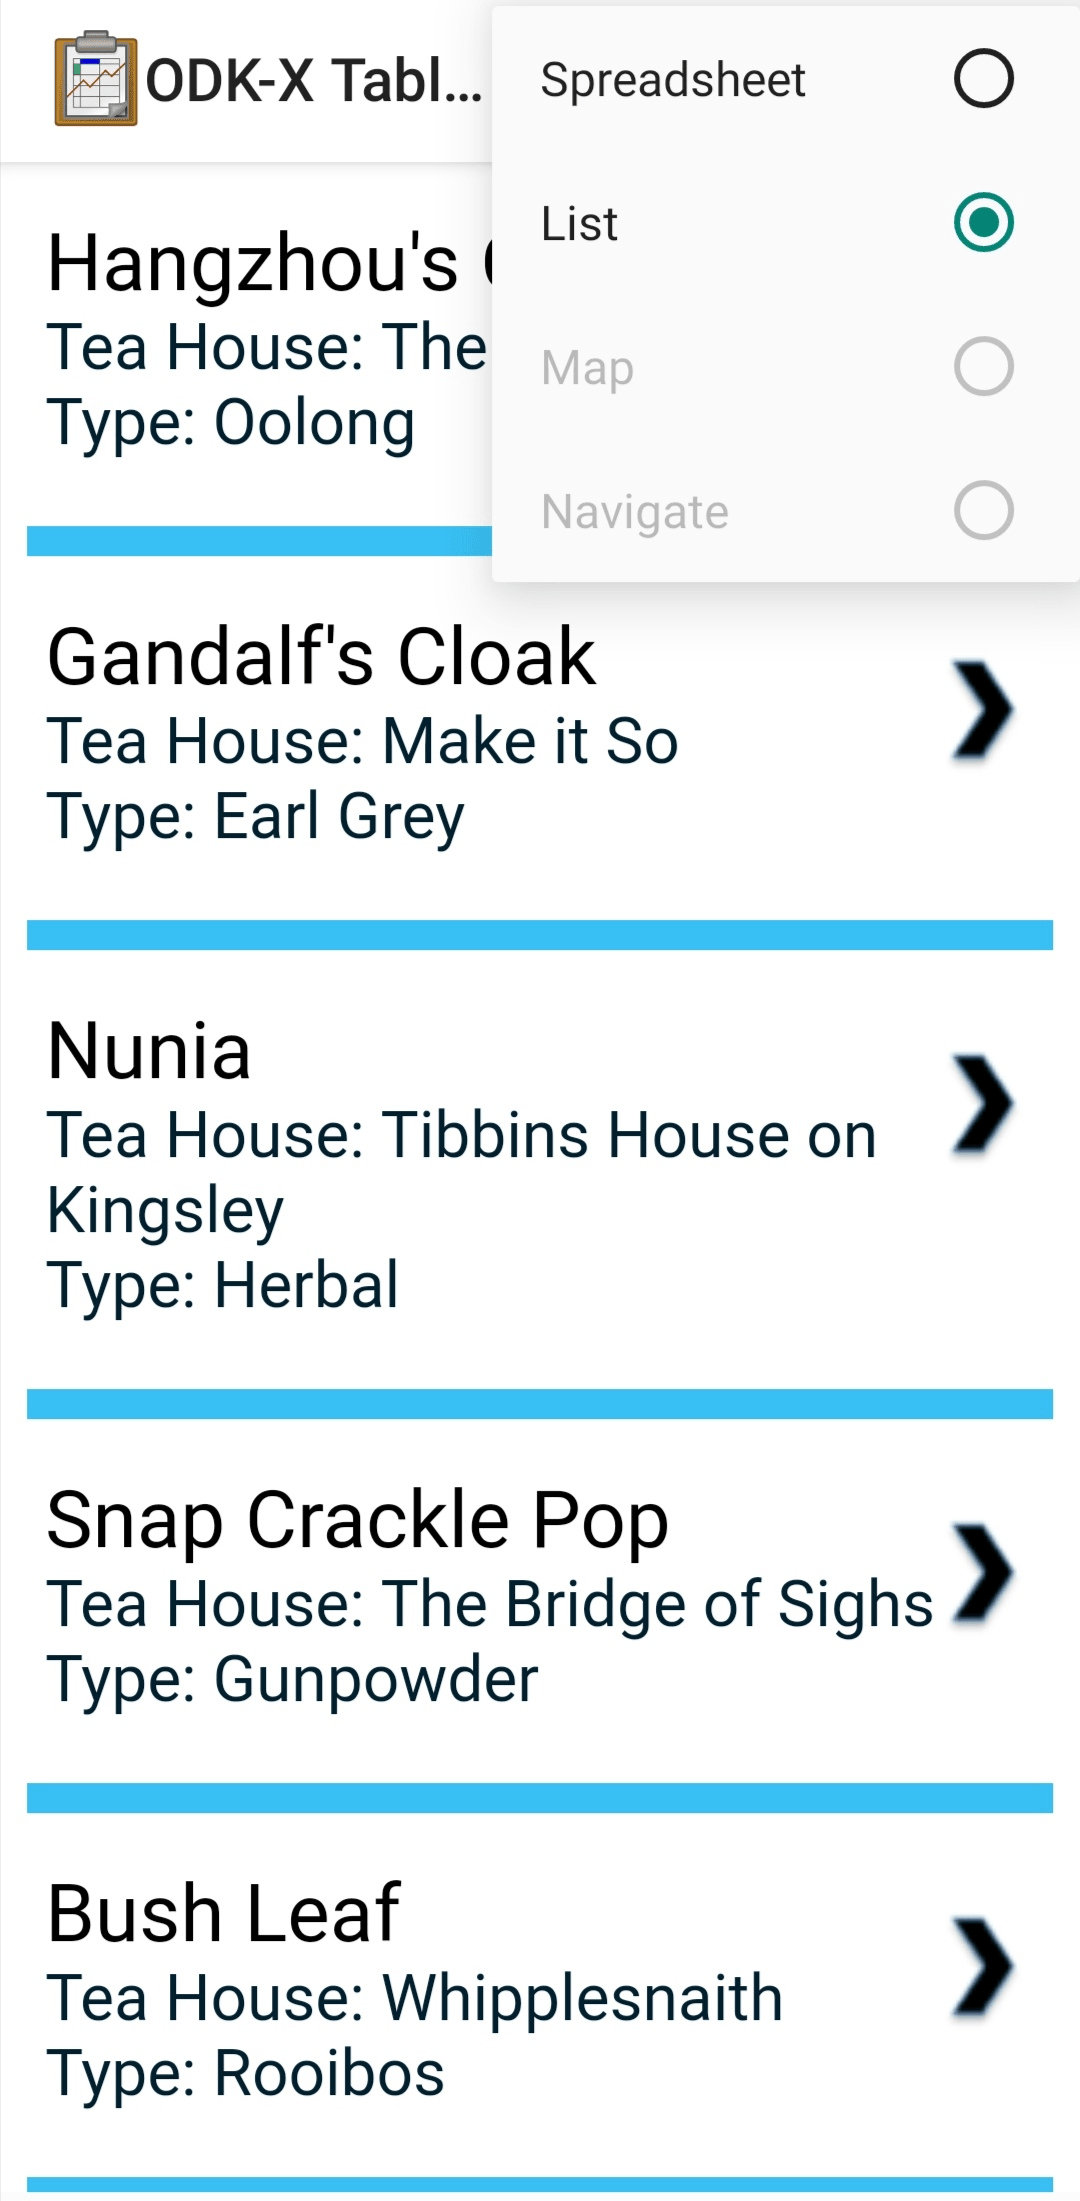
Note
Not all view types will always be available. For example, if the data set does not contain geographic data, the Map View and Navigate View options will not be available.
Creating and Editing Data
Tables supports creating new rows and editing existing records and provides a variety of methods to do so. These can be integrated into your Data Management Application's workflow or accessed directly.
Editing With Survey
Most data change options use Survey to create or update the record. These options will launch Survey from the Table in question to directly edit the relevant record, and then return control back to Tables where you left off. Which options are available depends on which view type you are currently using.
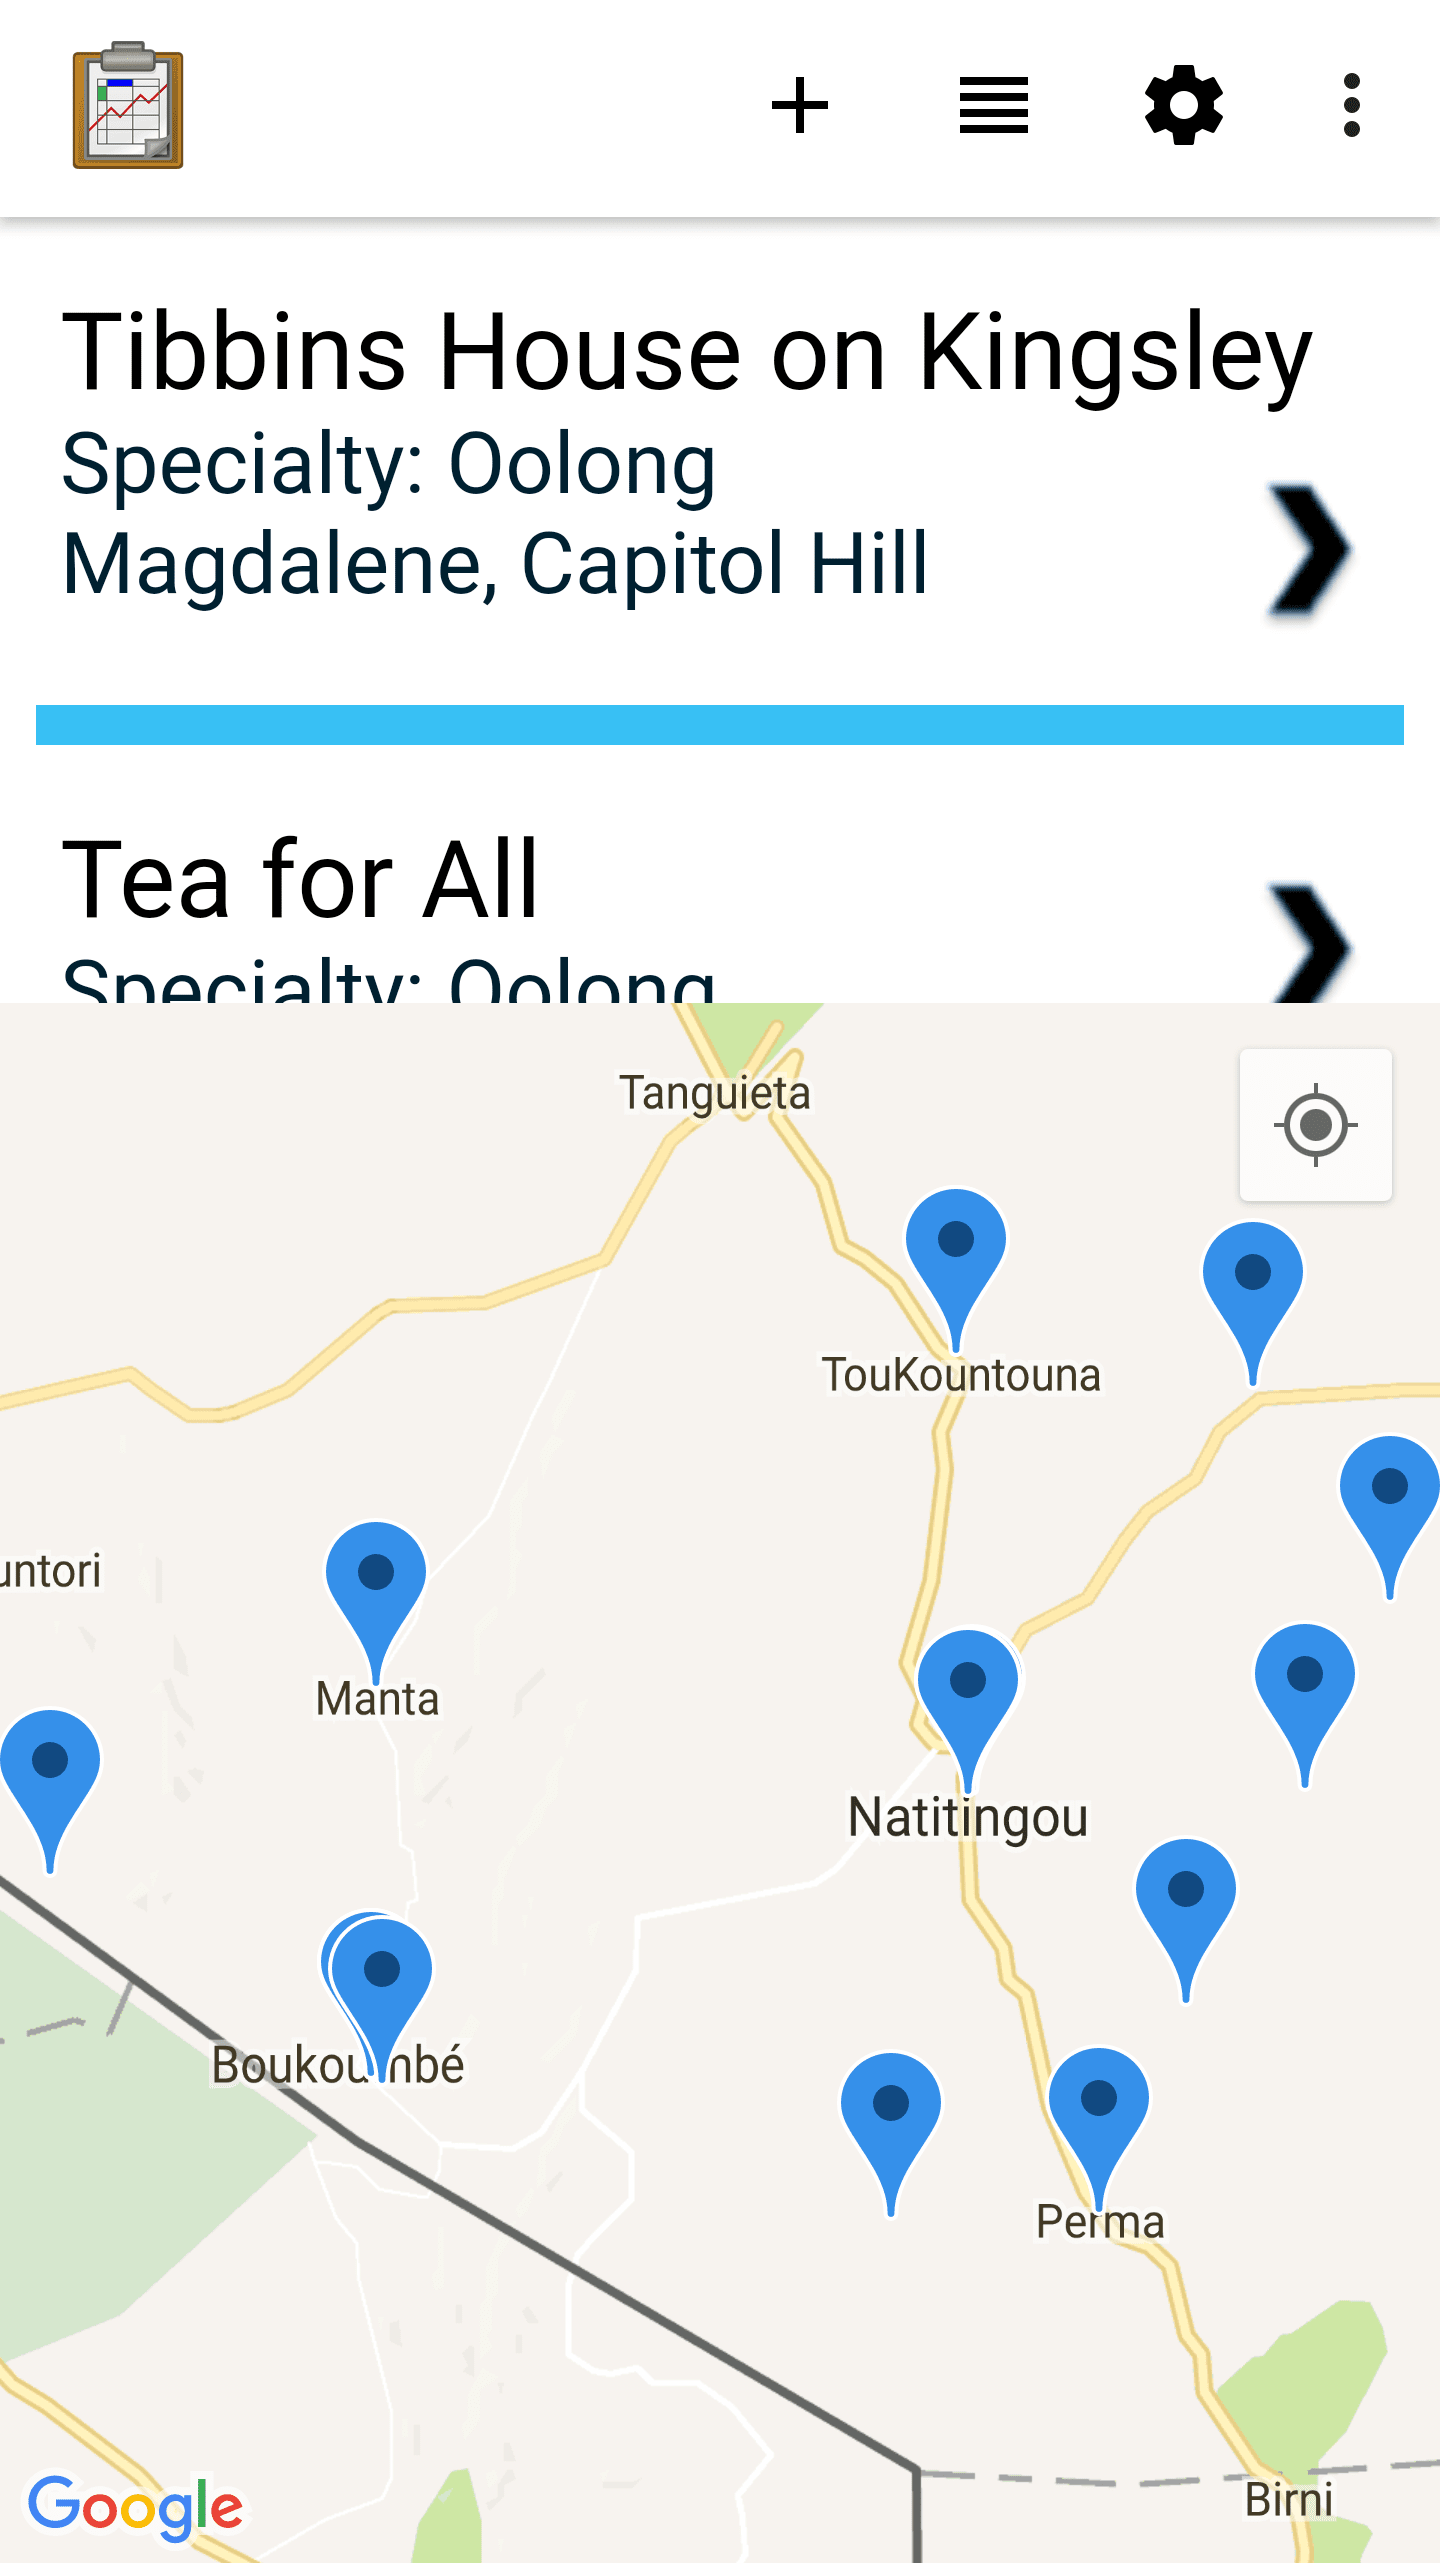
Creating a Record: The + Button
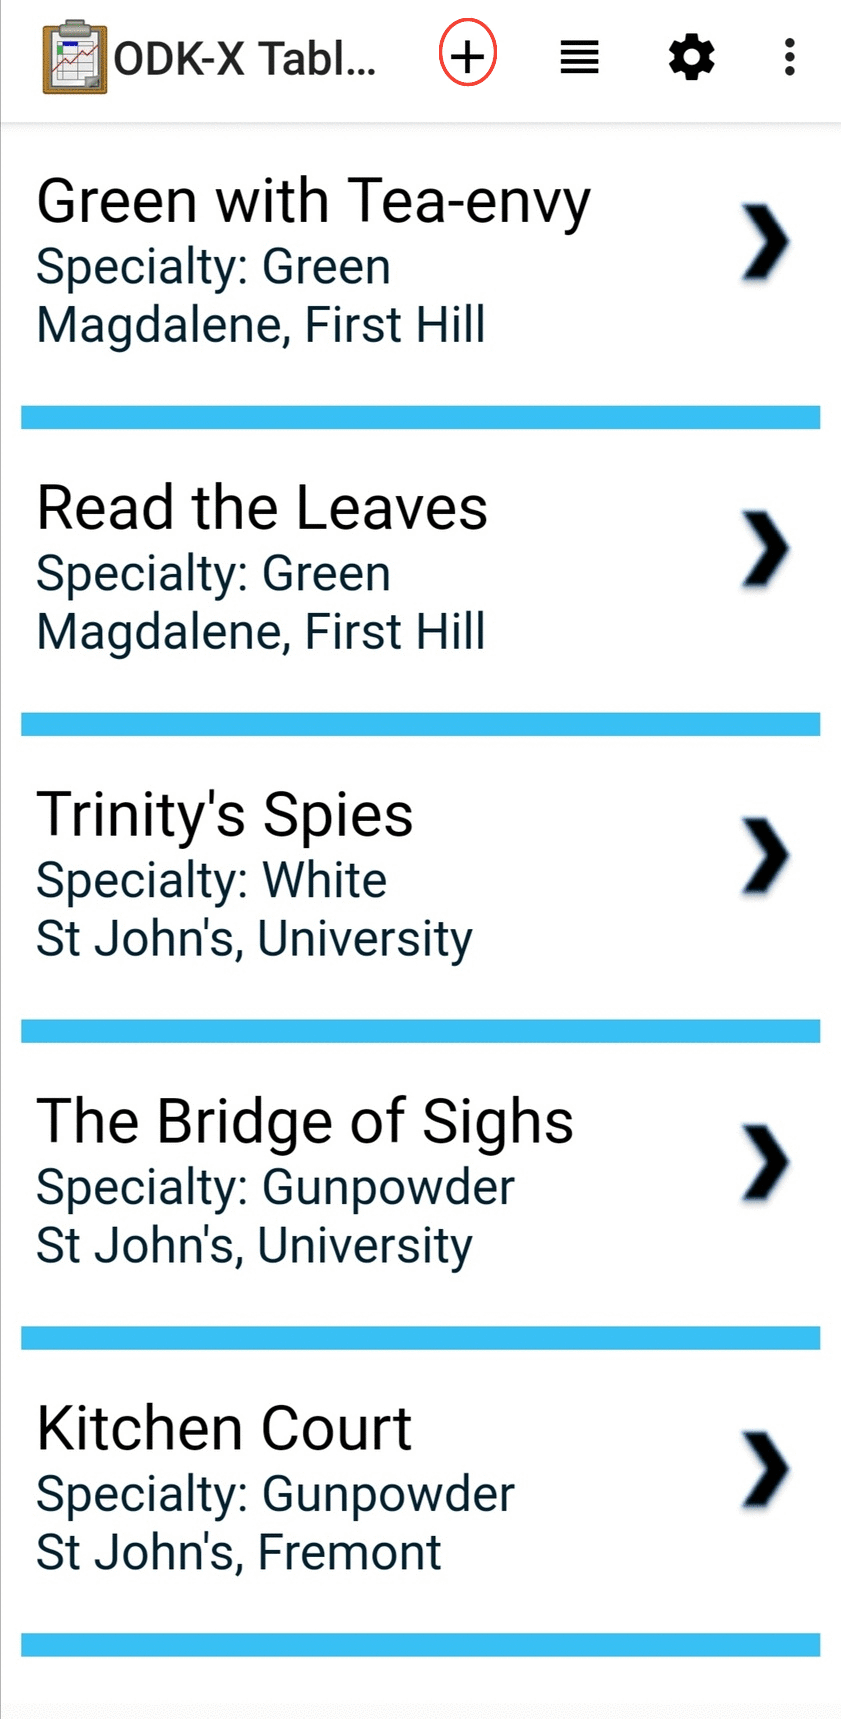
The + button is available in any of the multi-record views: List View, Graph View, Map View, and Navigate View. This button will launch the configured Survey form to create a new record in the table currently being viewed. The example picture above shows the Tea Houses List View from the Trying Out ODK-X Tables. If the + is pressed it will launch a Survey to create a new tea house in the table.
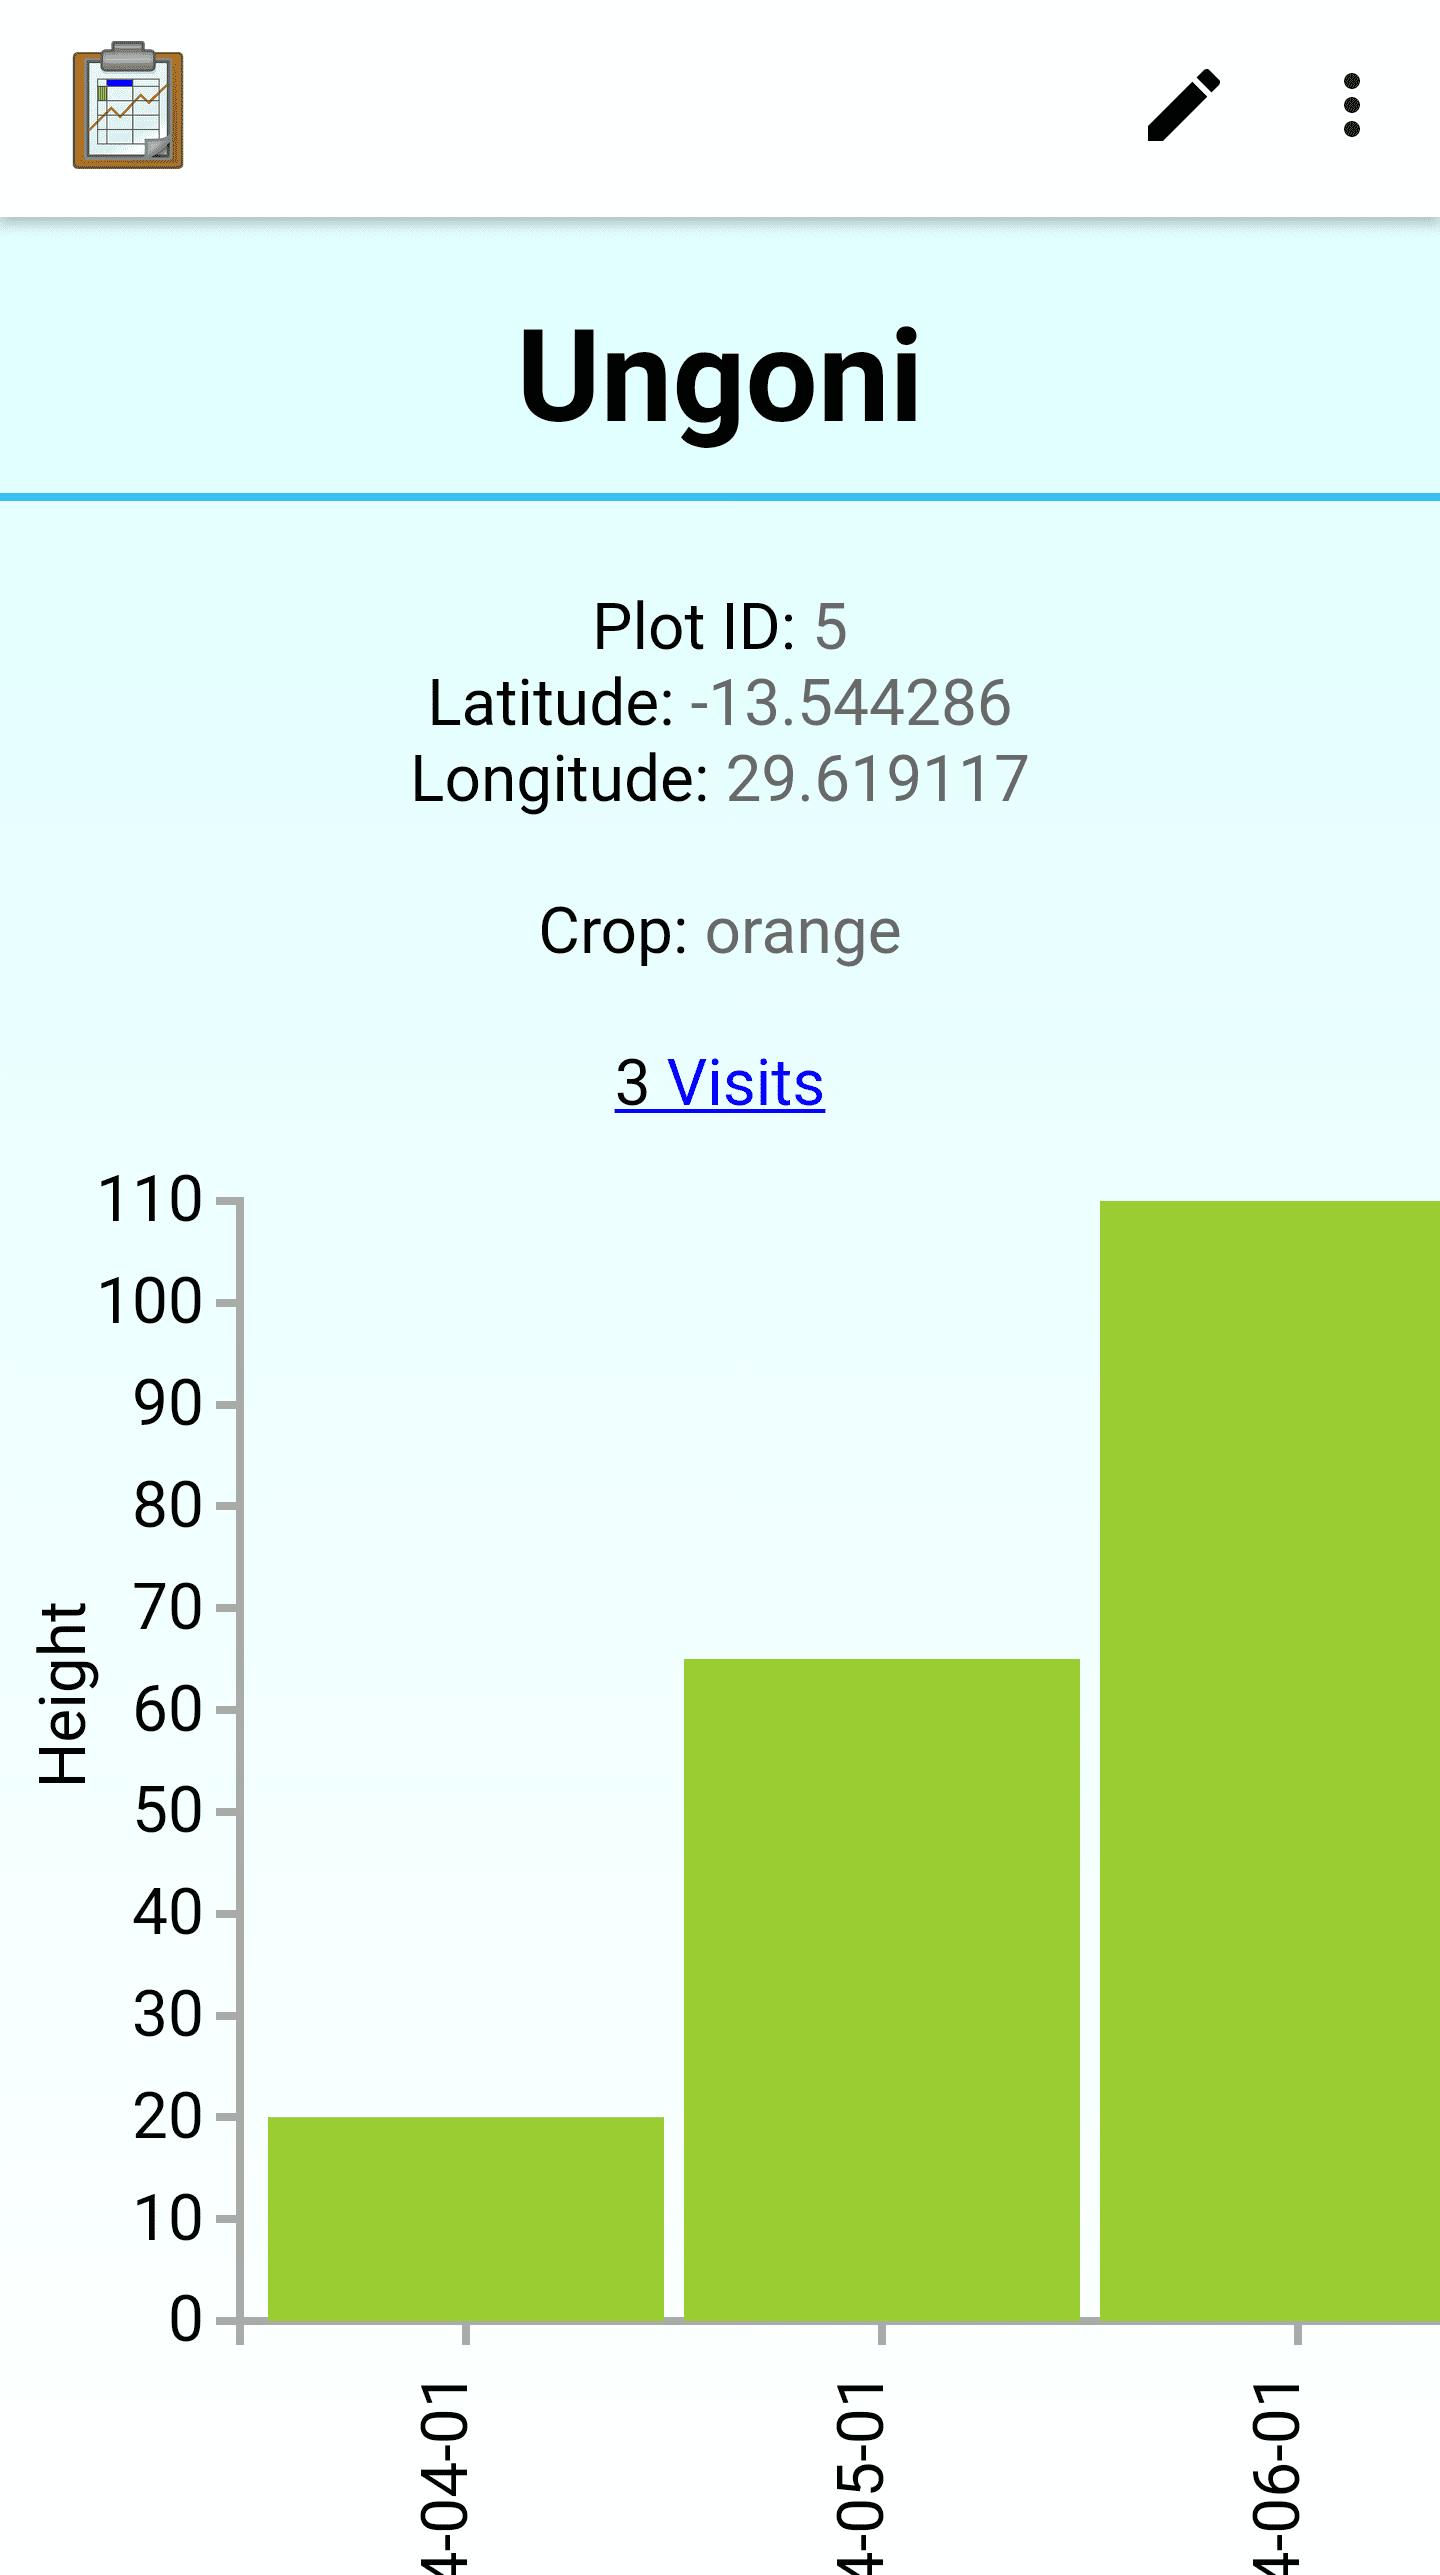
Editing a Record: The Pencil Button
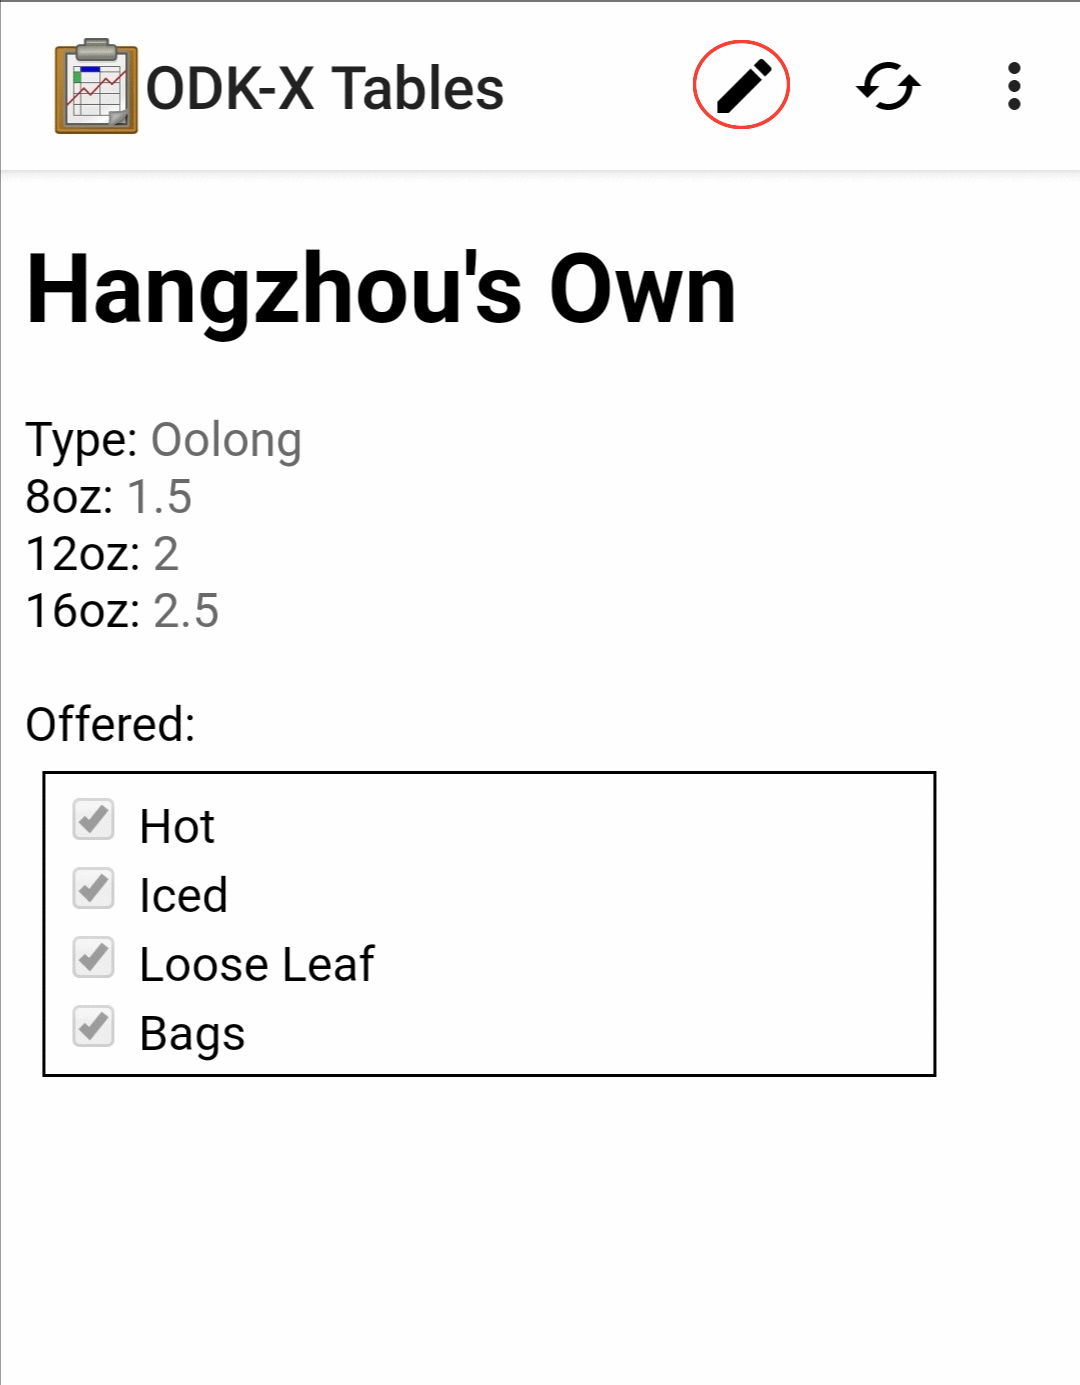
The pencil button is available in any of the single record views: Detail View and Detail With Sublist View. Detail With Sublist View is considered a single record view as the Detail View portion is considered the controlling view, and the List View below is subordinate.
If the pencil button is pressed, it will launch the configured Survey form to edit the record currently be viewed. When the record has been updated and control returns to the calling view, the new details should be rendered in that view.
Spreadsheet View
Spreadsheet View also offers methods to launch Survey to create or edit records. If you know exactly the table or record you want to edit, this view may be the more direct option. You can also use Color Rules to find records that require your attention and then edit them directly.
Creating a Record follows the same workflow as the other multirecord views. Press the + button to create a new row in the data table and see it in the Spreadsheet View.
Editing a Record can be performed by long pressing on the desired row. A pop up will open when the long press is released.
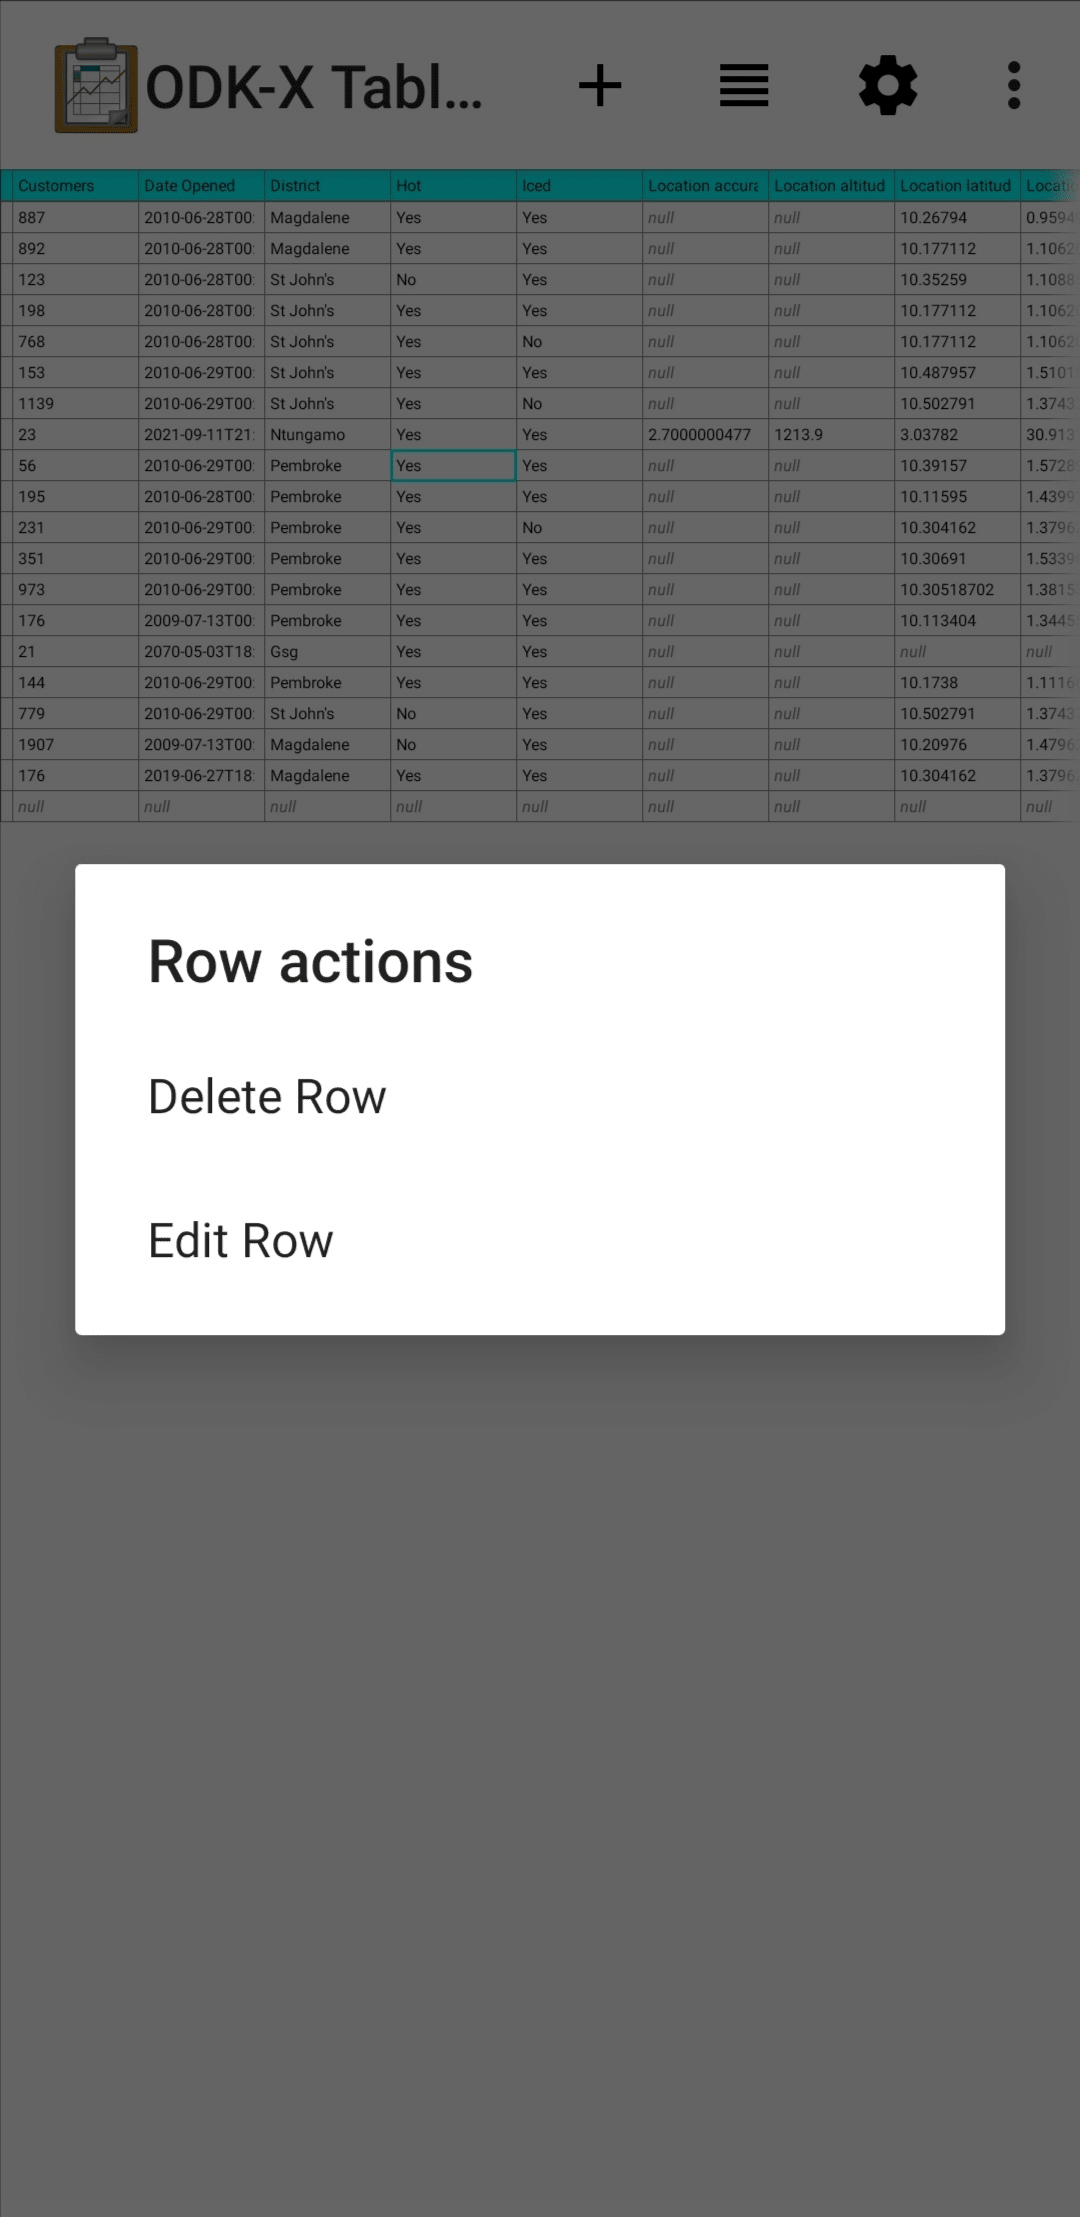
This gives you the option to:
Delete Row - This will produce a confirmation dialog make sure you want to delete the record. If affirmed, the row will be marked for deleted (or marked for deletion on the next synchronization).
Edit Row - This will launch the Survey form corresponding to this record, similar to the pencil button.
Editing Directly in Tables: Custom Views
Tables supports direct creation and updates to data in the database through JavaScript API calls. These will be completely customized to your organization's Data Management Application and you may need to contact that person to find out how to use your particular design.
For more information on how to edit data with these custom views, see Creating Customized Web Views.
Syncing Data
See the instructions in the ODK-X Services user guide.
Warning
If a data table has any checkpoint saves (for example, caused by form crashes), the data table will not be synchronized. Checkpoints must be resolved before sync can proceed. The user must open a form on the problem table and either delete the checkpoint or edit the checkpoint. If editing, after that is complete they must save is as either incomplete or finalized. Once the checkpoints are eliminated, the user can initiate another synchronization, and the data in this table will then be synchronized with the information on the server.