Plot Demo
For this portion of the tutorial, we will explore the Plot demo. Select the tab labeled Plot and press Launch Demo.
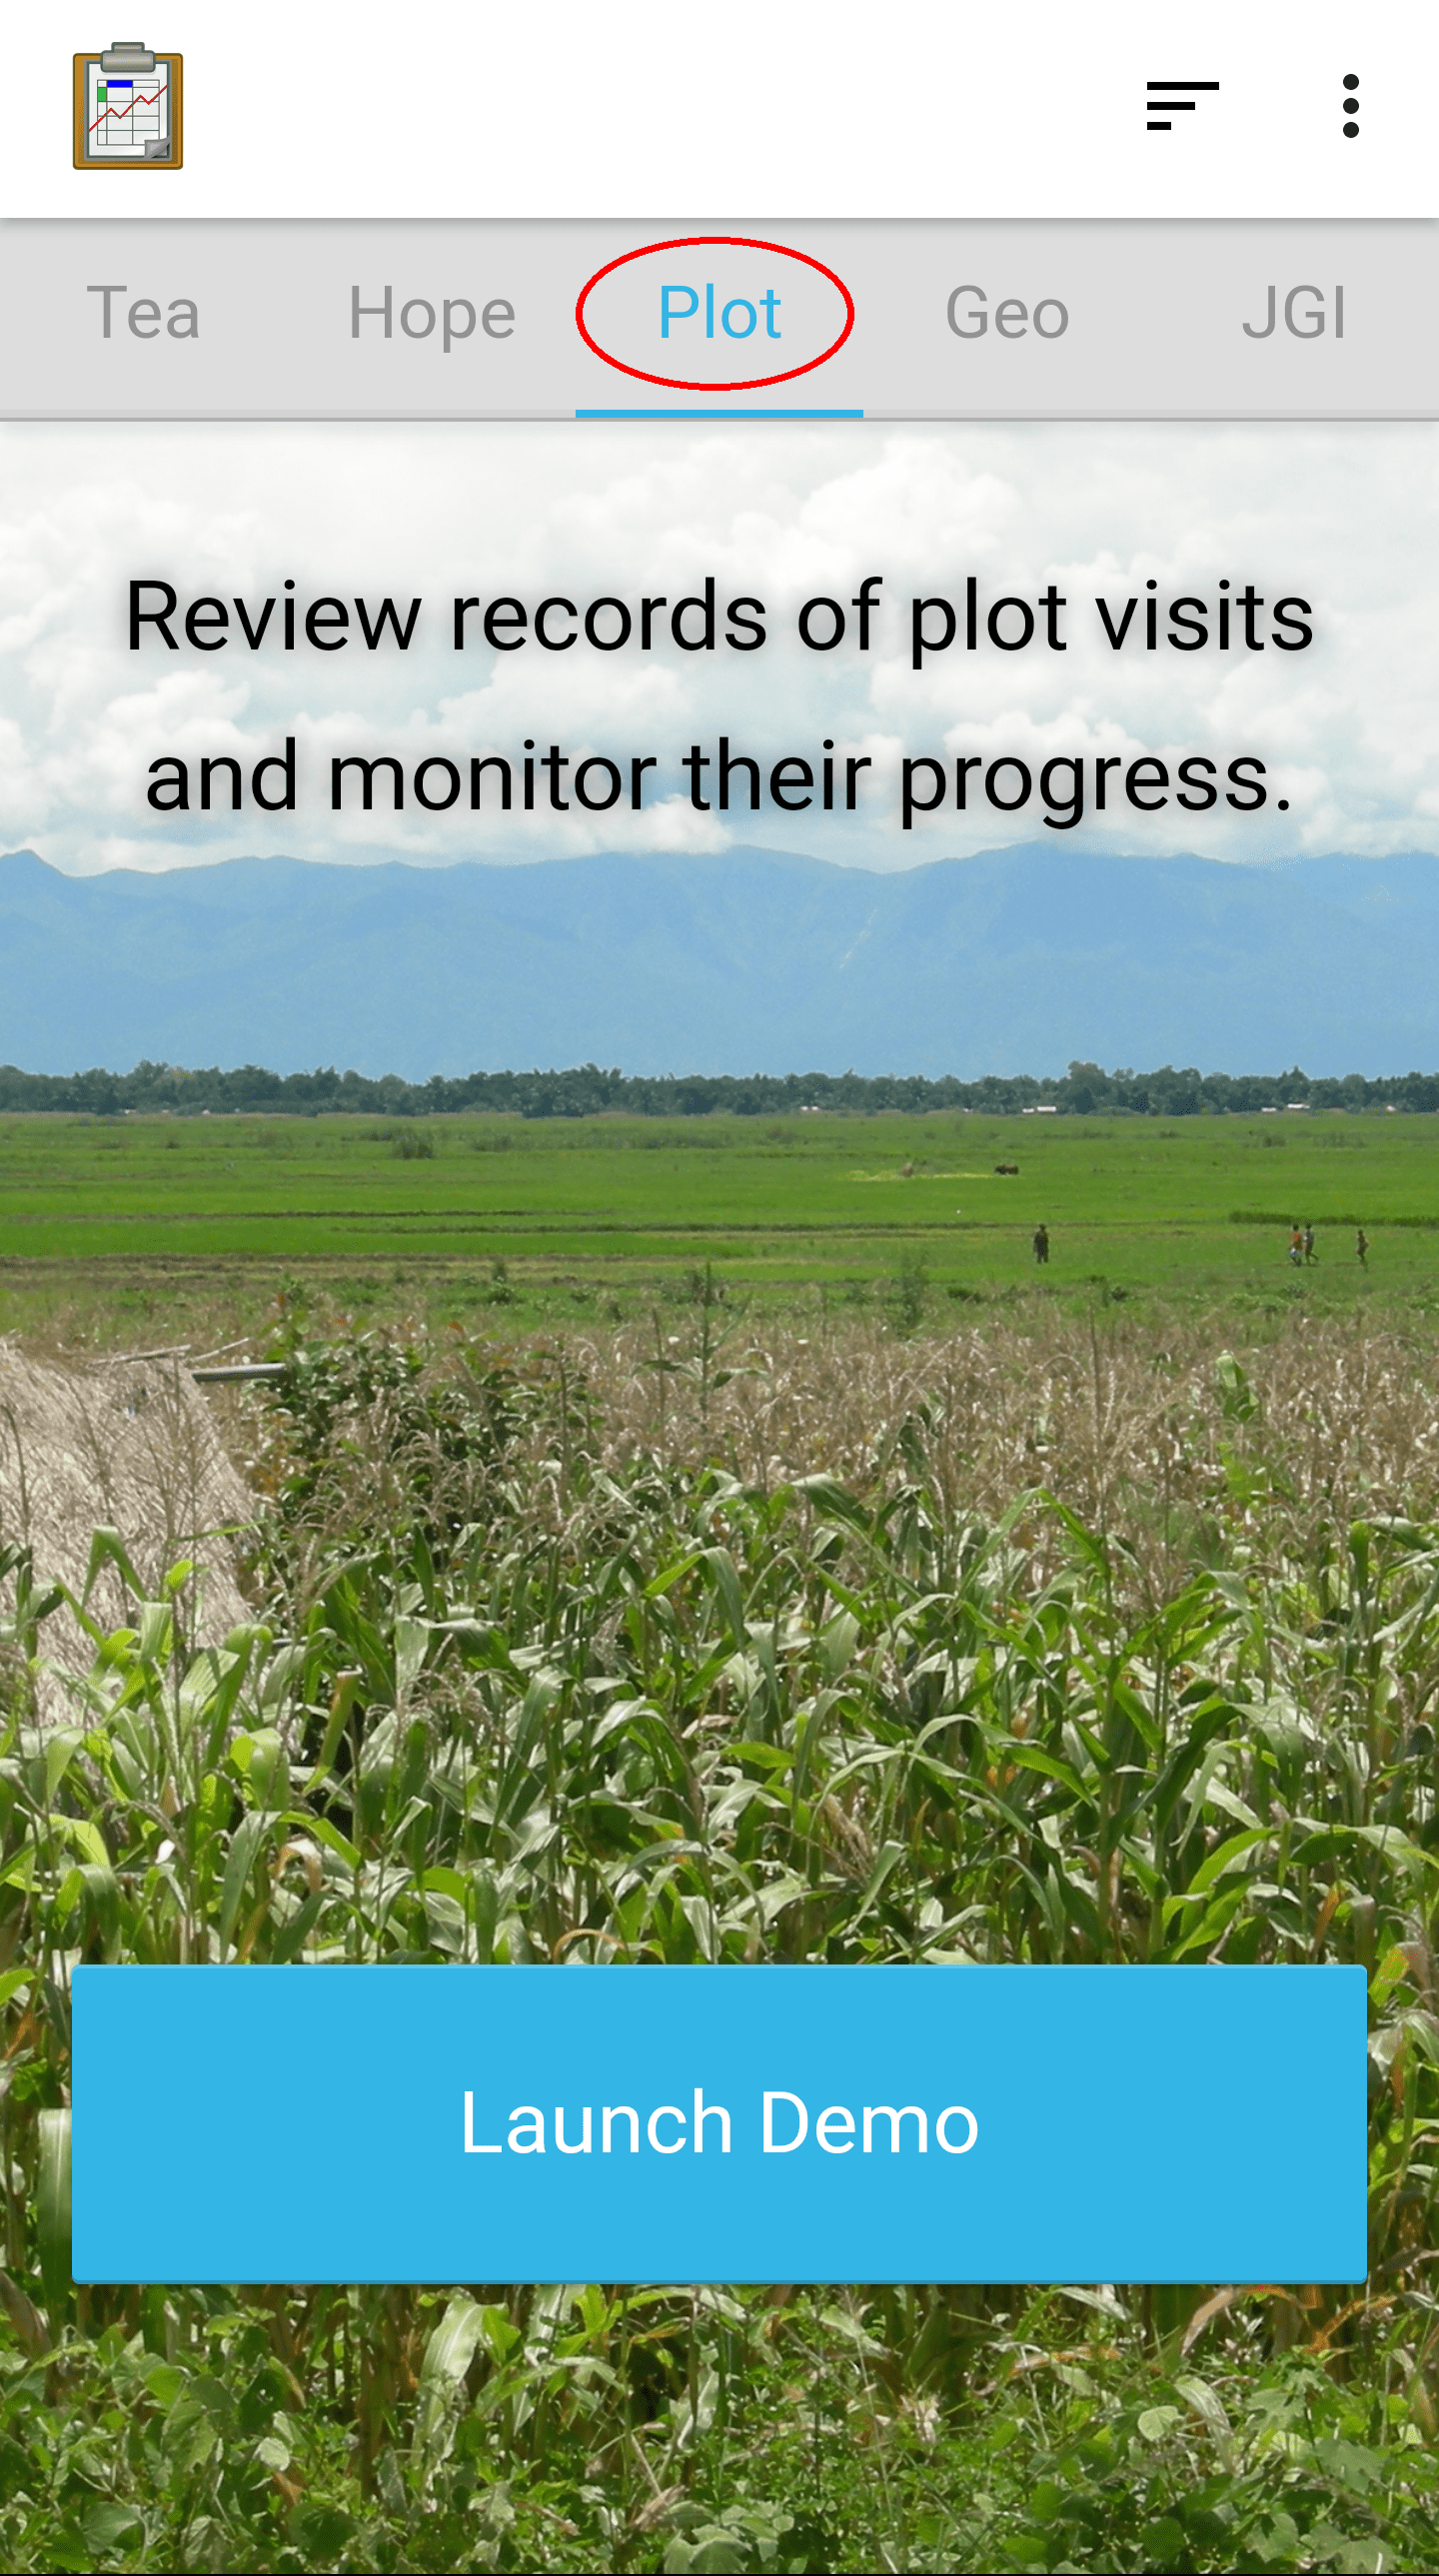
The Plot demo is a fictional collection of crop data and graphs of that data.
Graph View
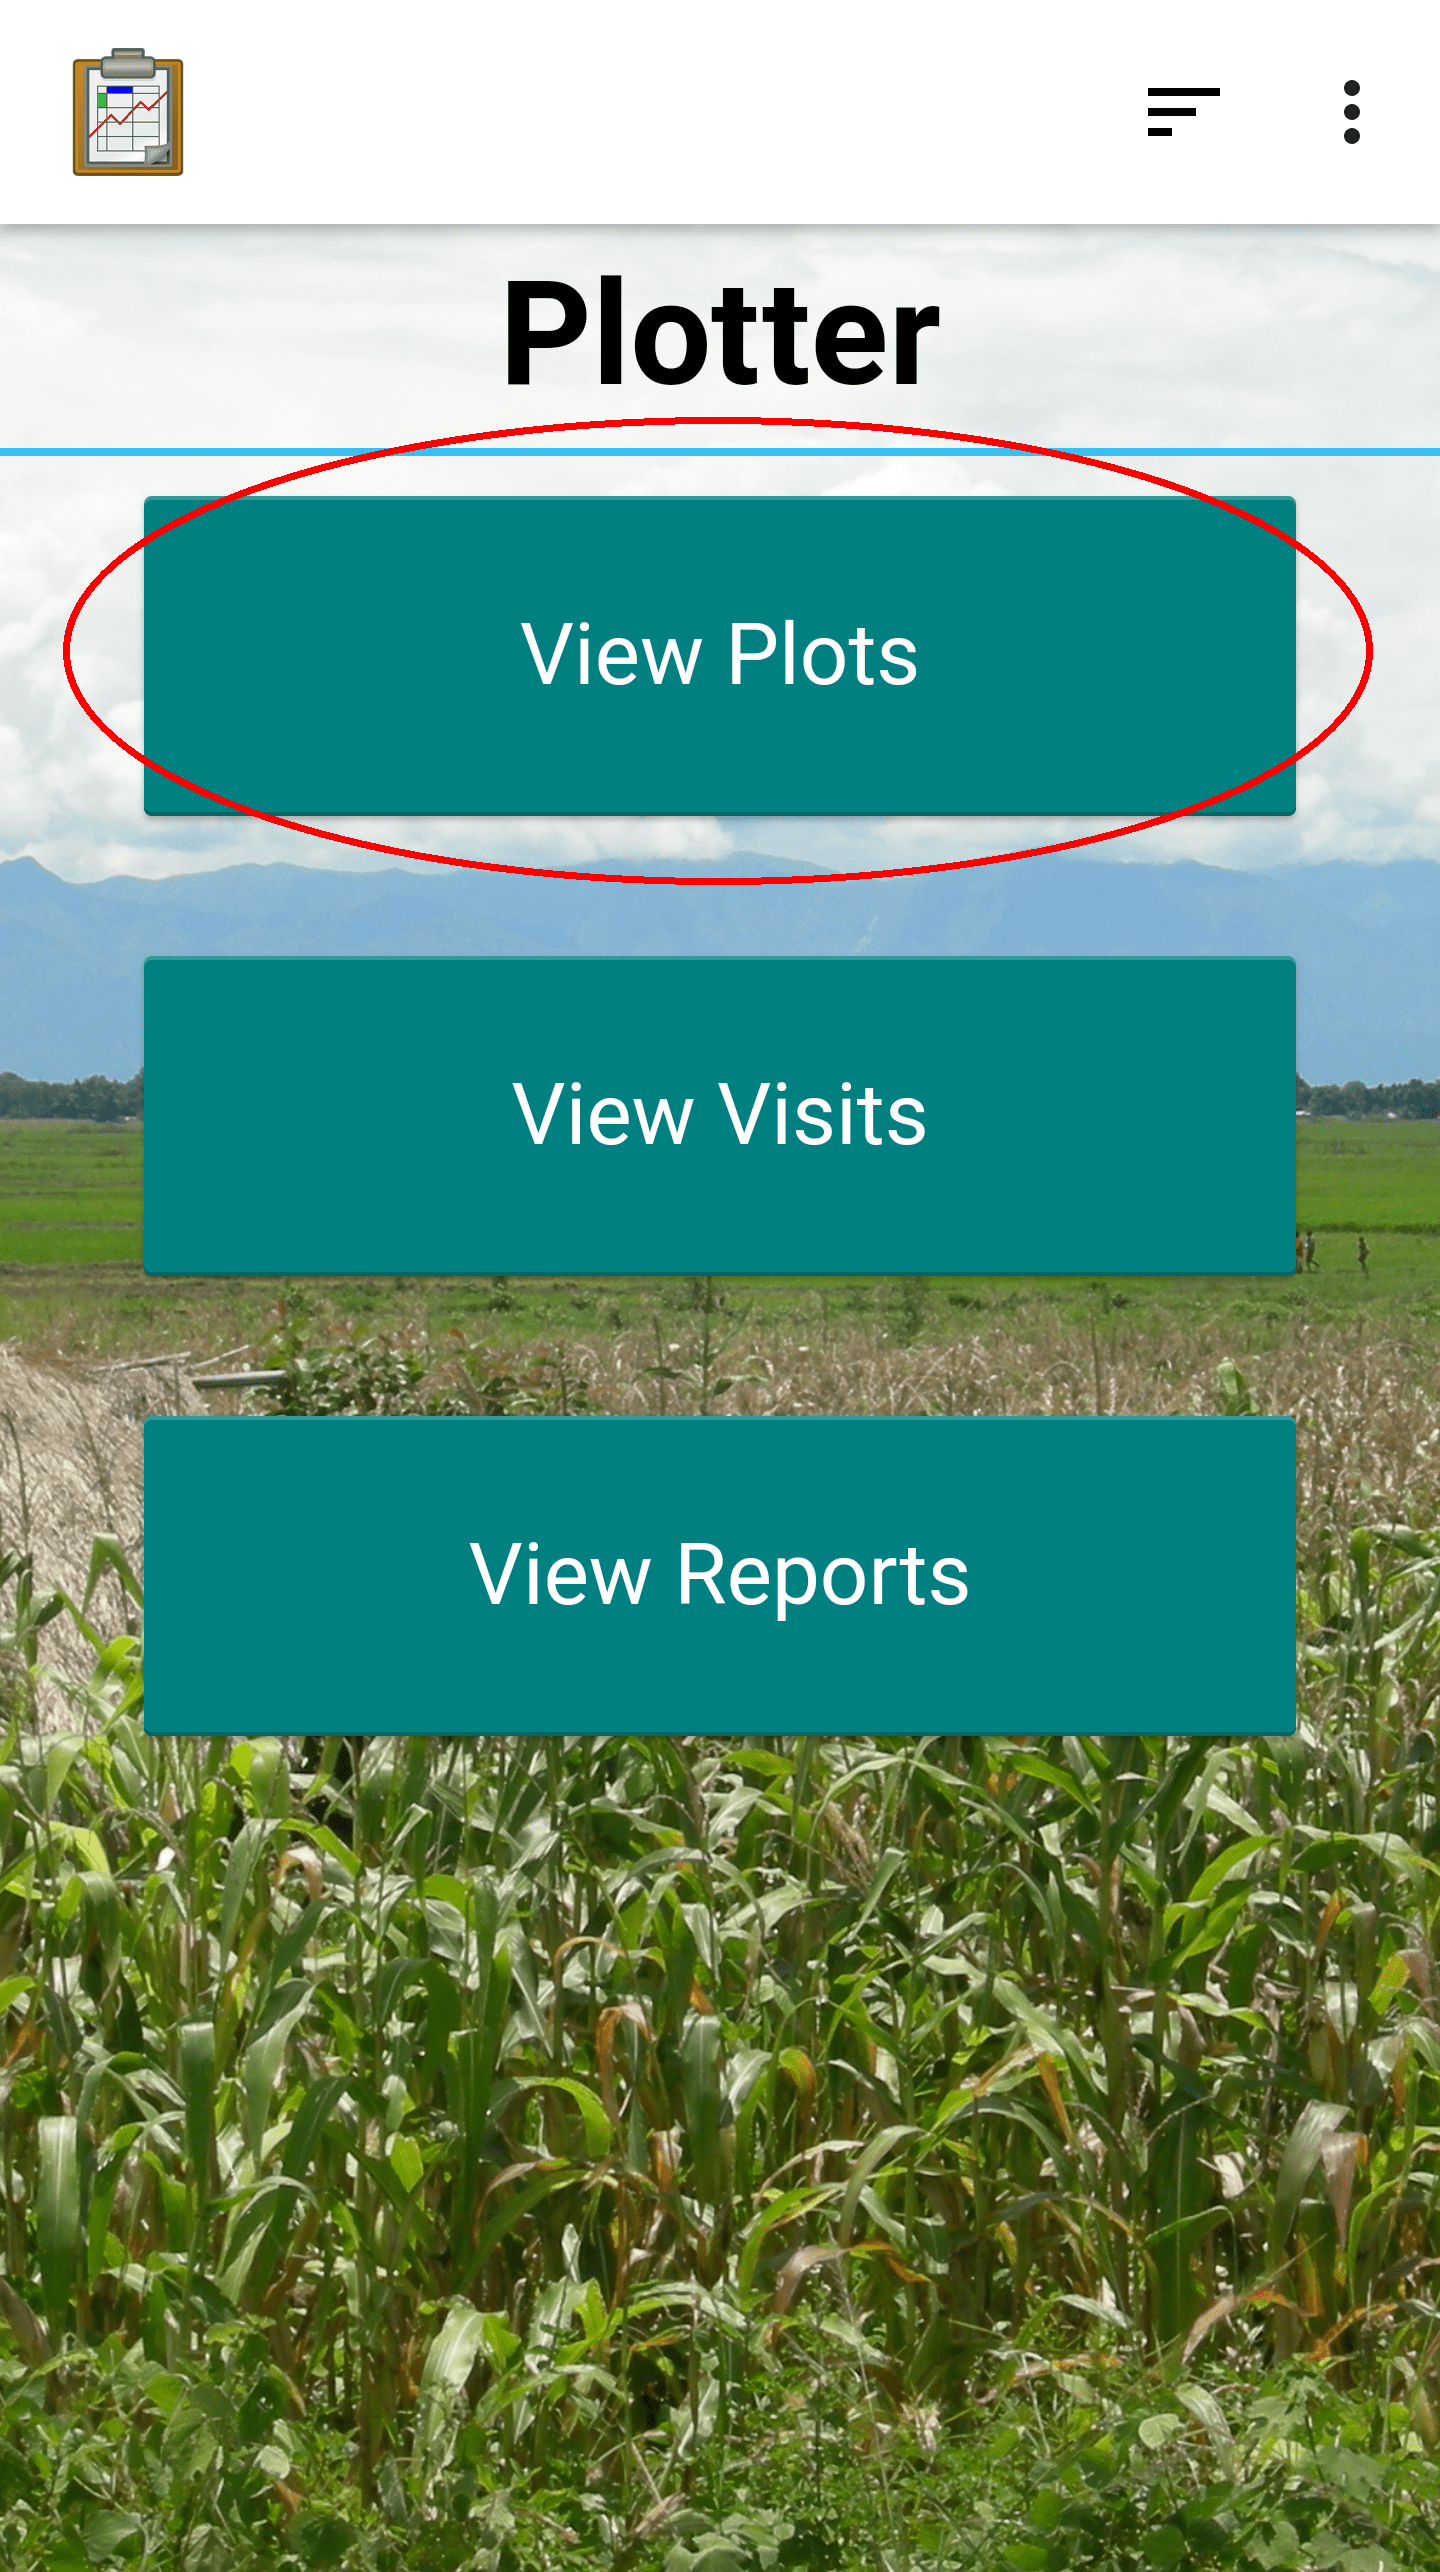
After launching the Plot demo app, you will see a custom view that lets you select which crop data you want to see. Choose View Plots.
The next screen is a Map View of the different sites in the records.
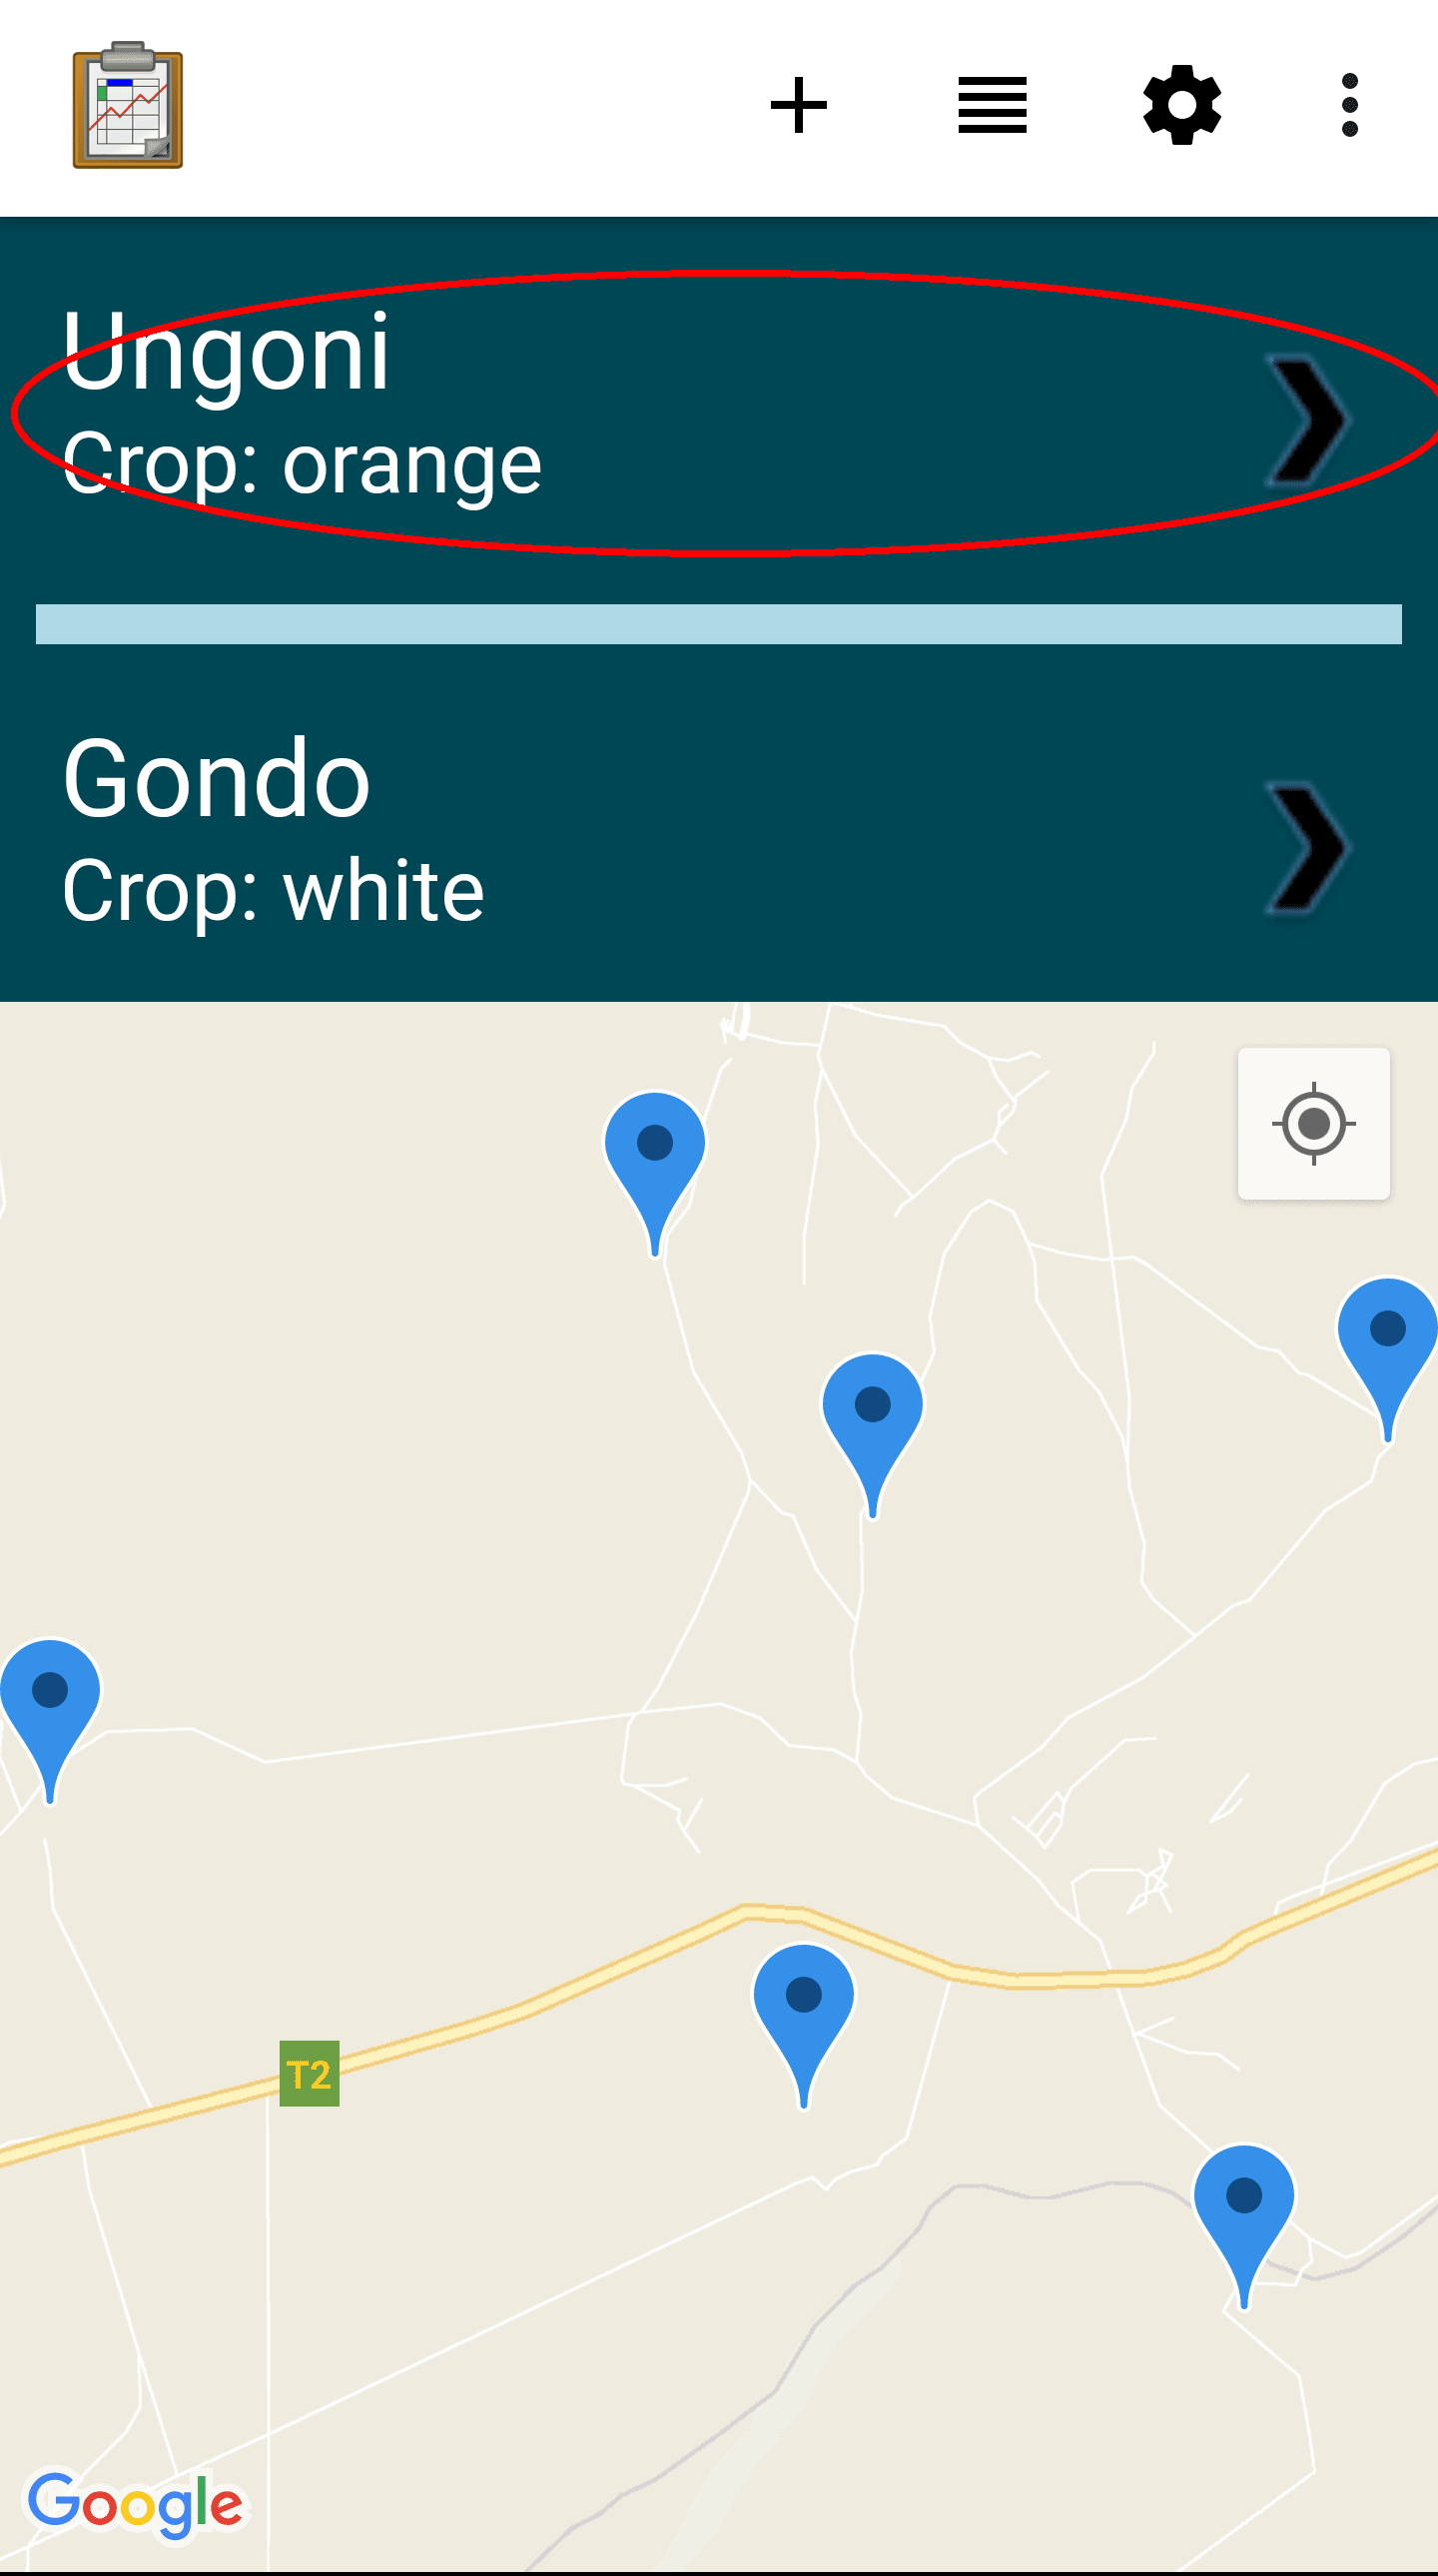
Each site is meant to represent an area where crop growth and health is being tracked. This provides a convenient view of the locations of the sample sites, and would be a good use for the Navigation View if a user had trouble finding one of the sites. Choose the site.
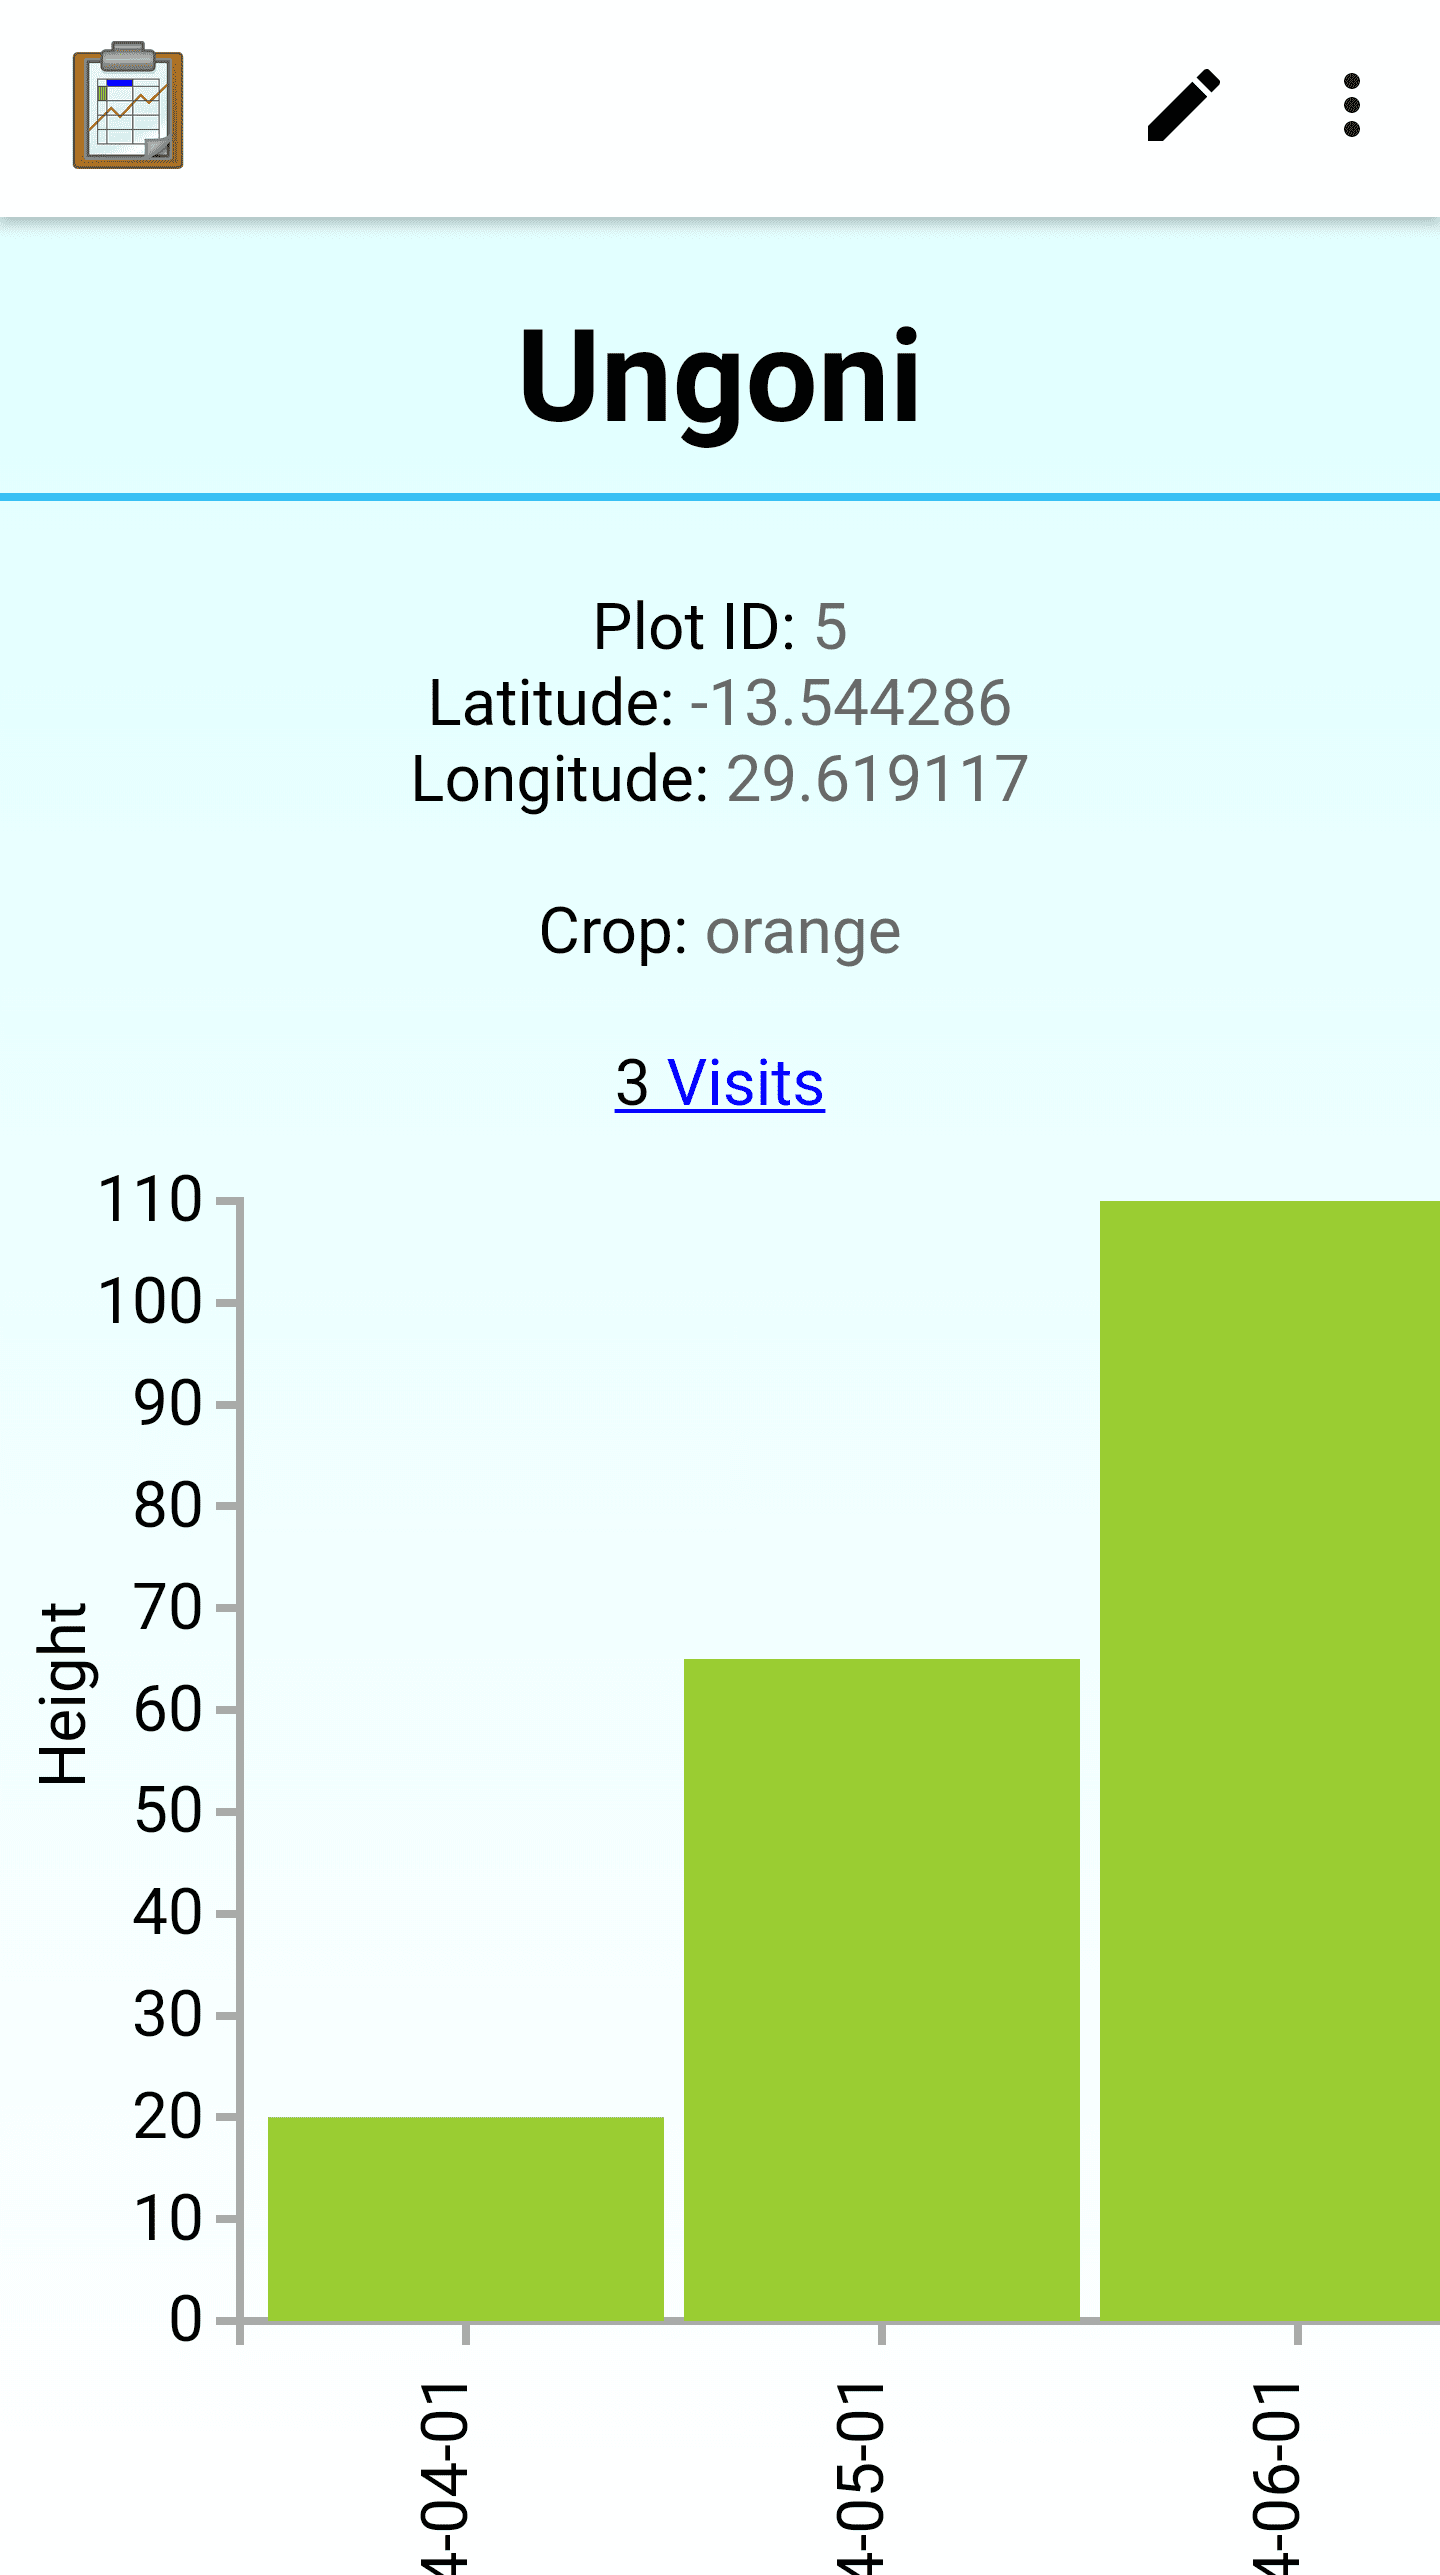
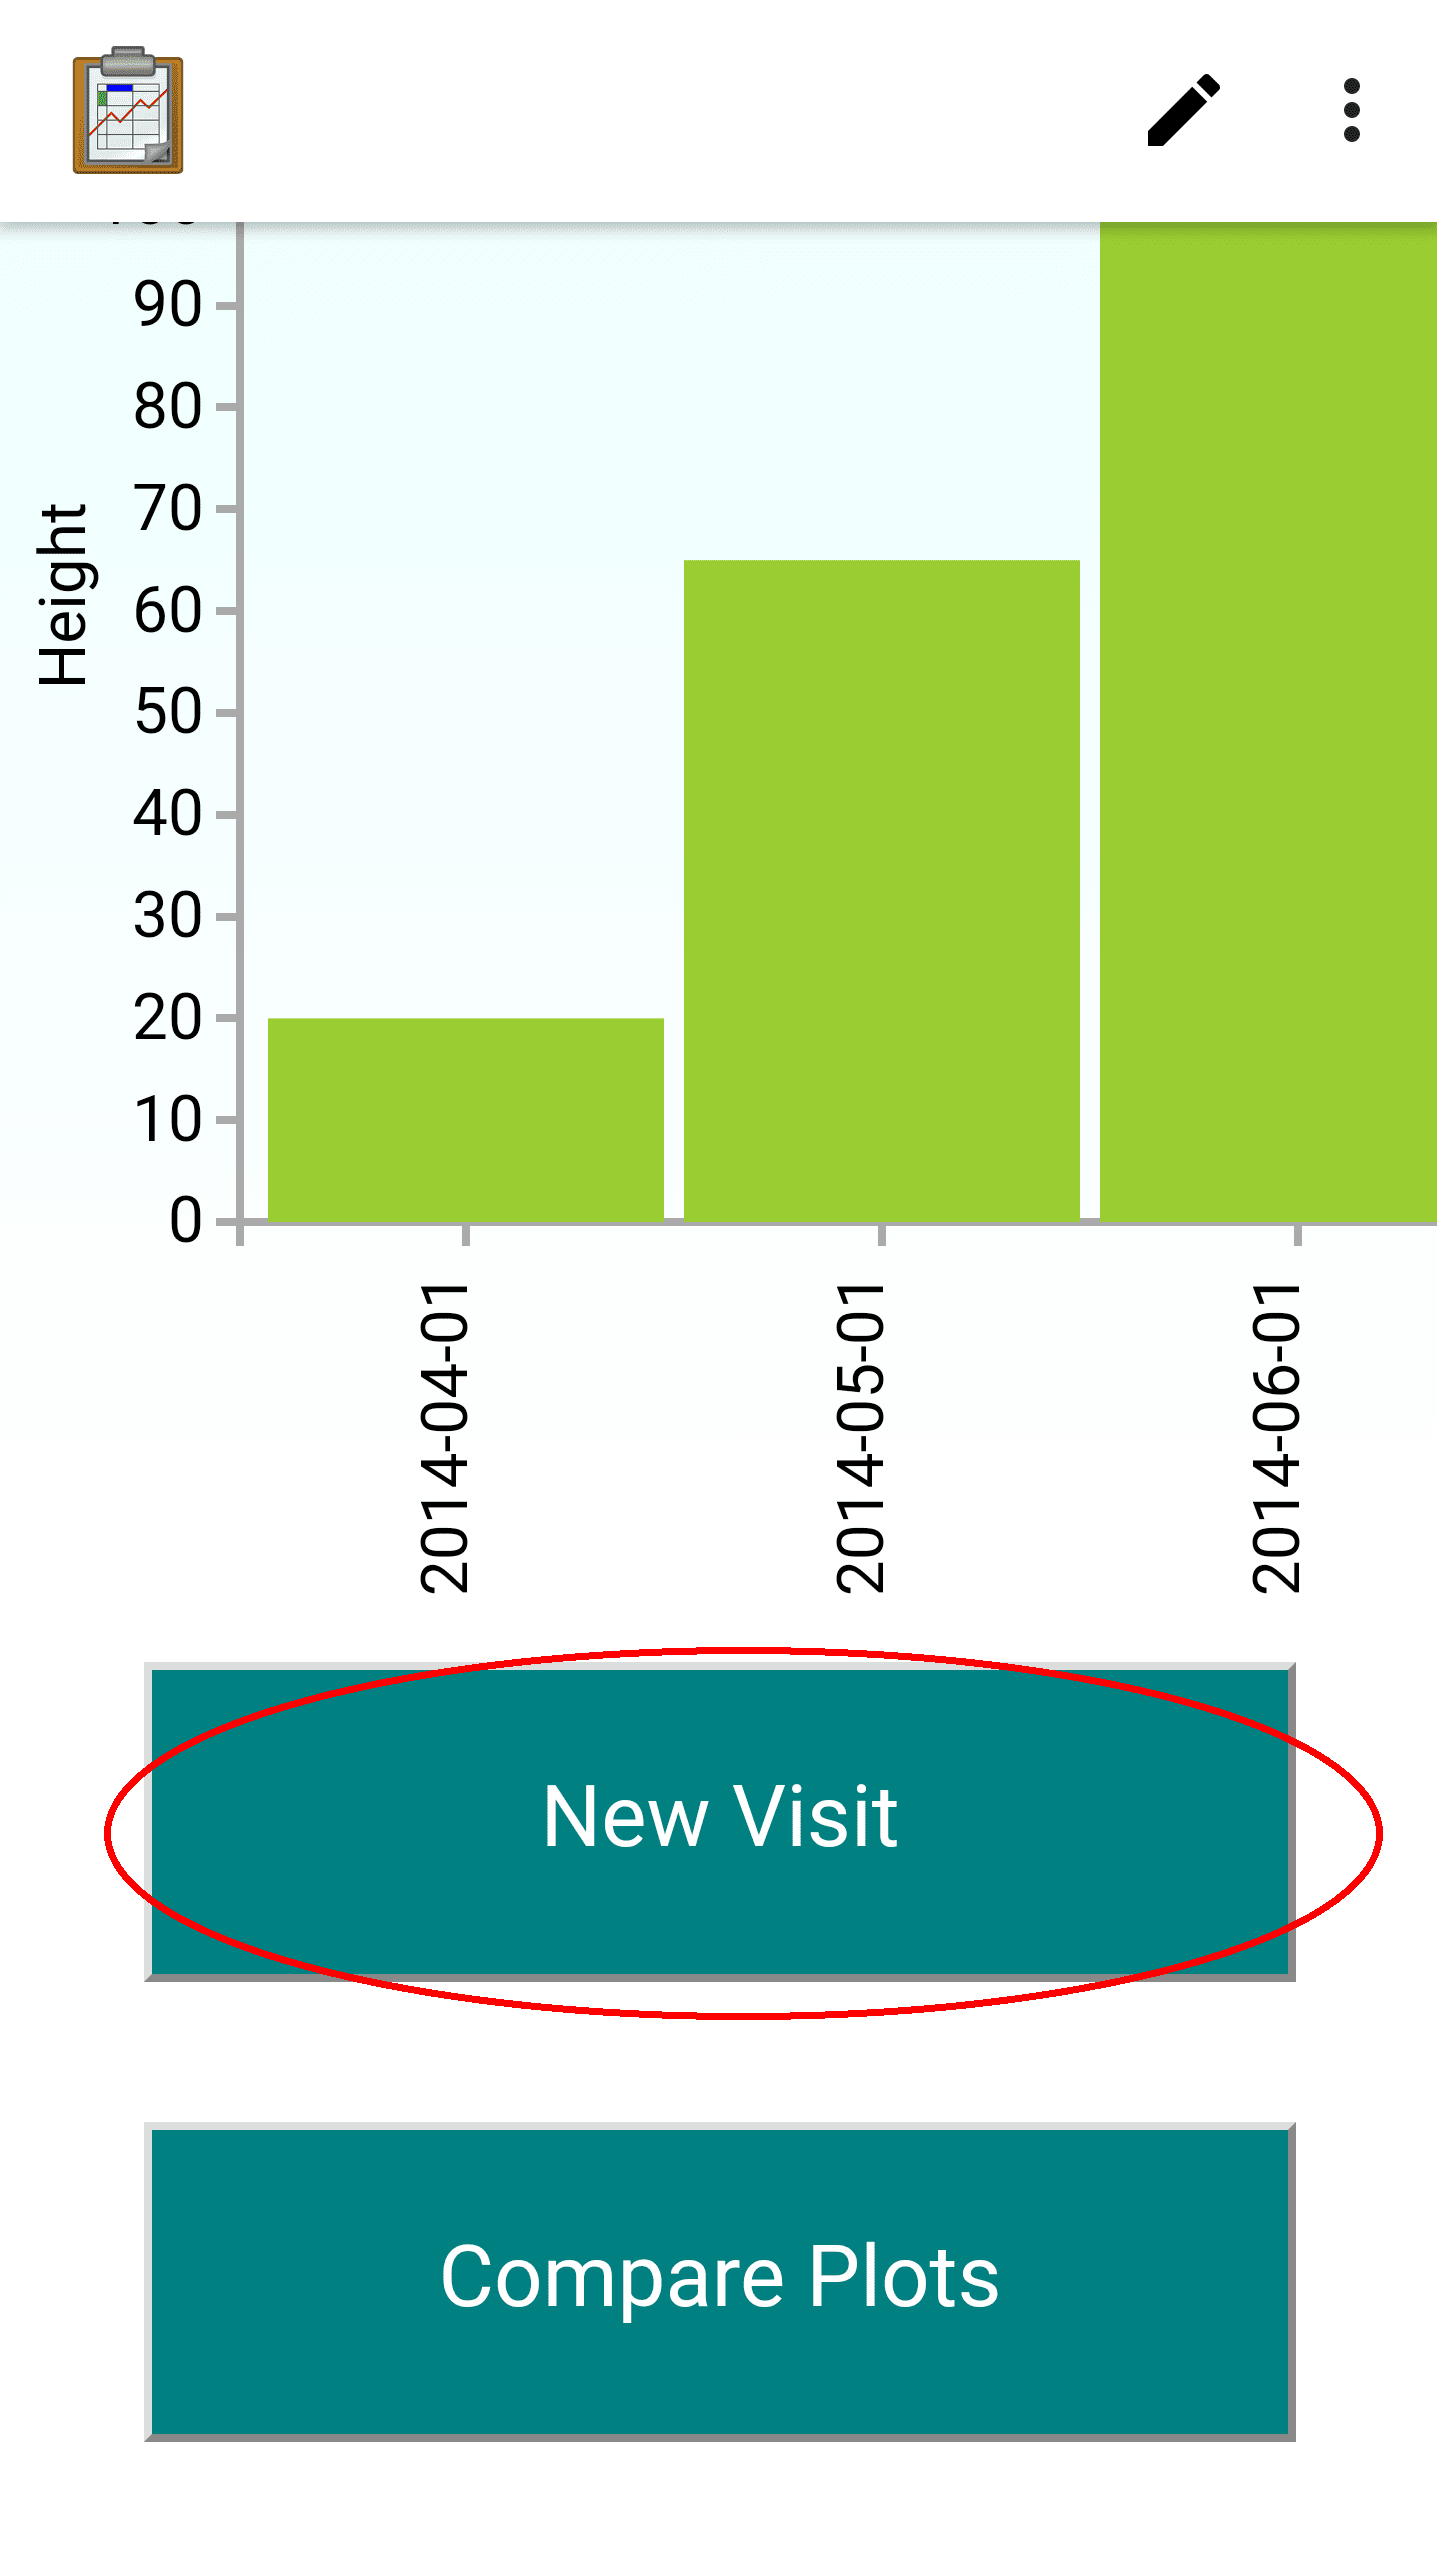
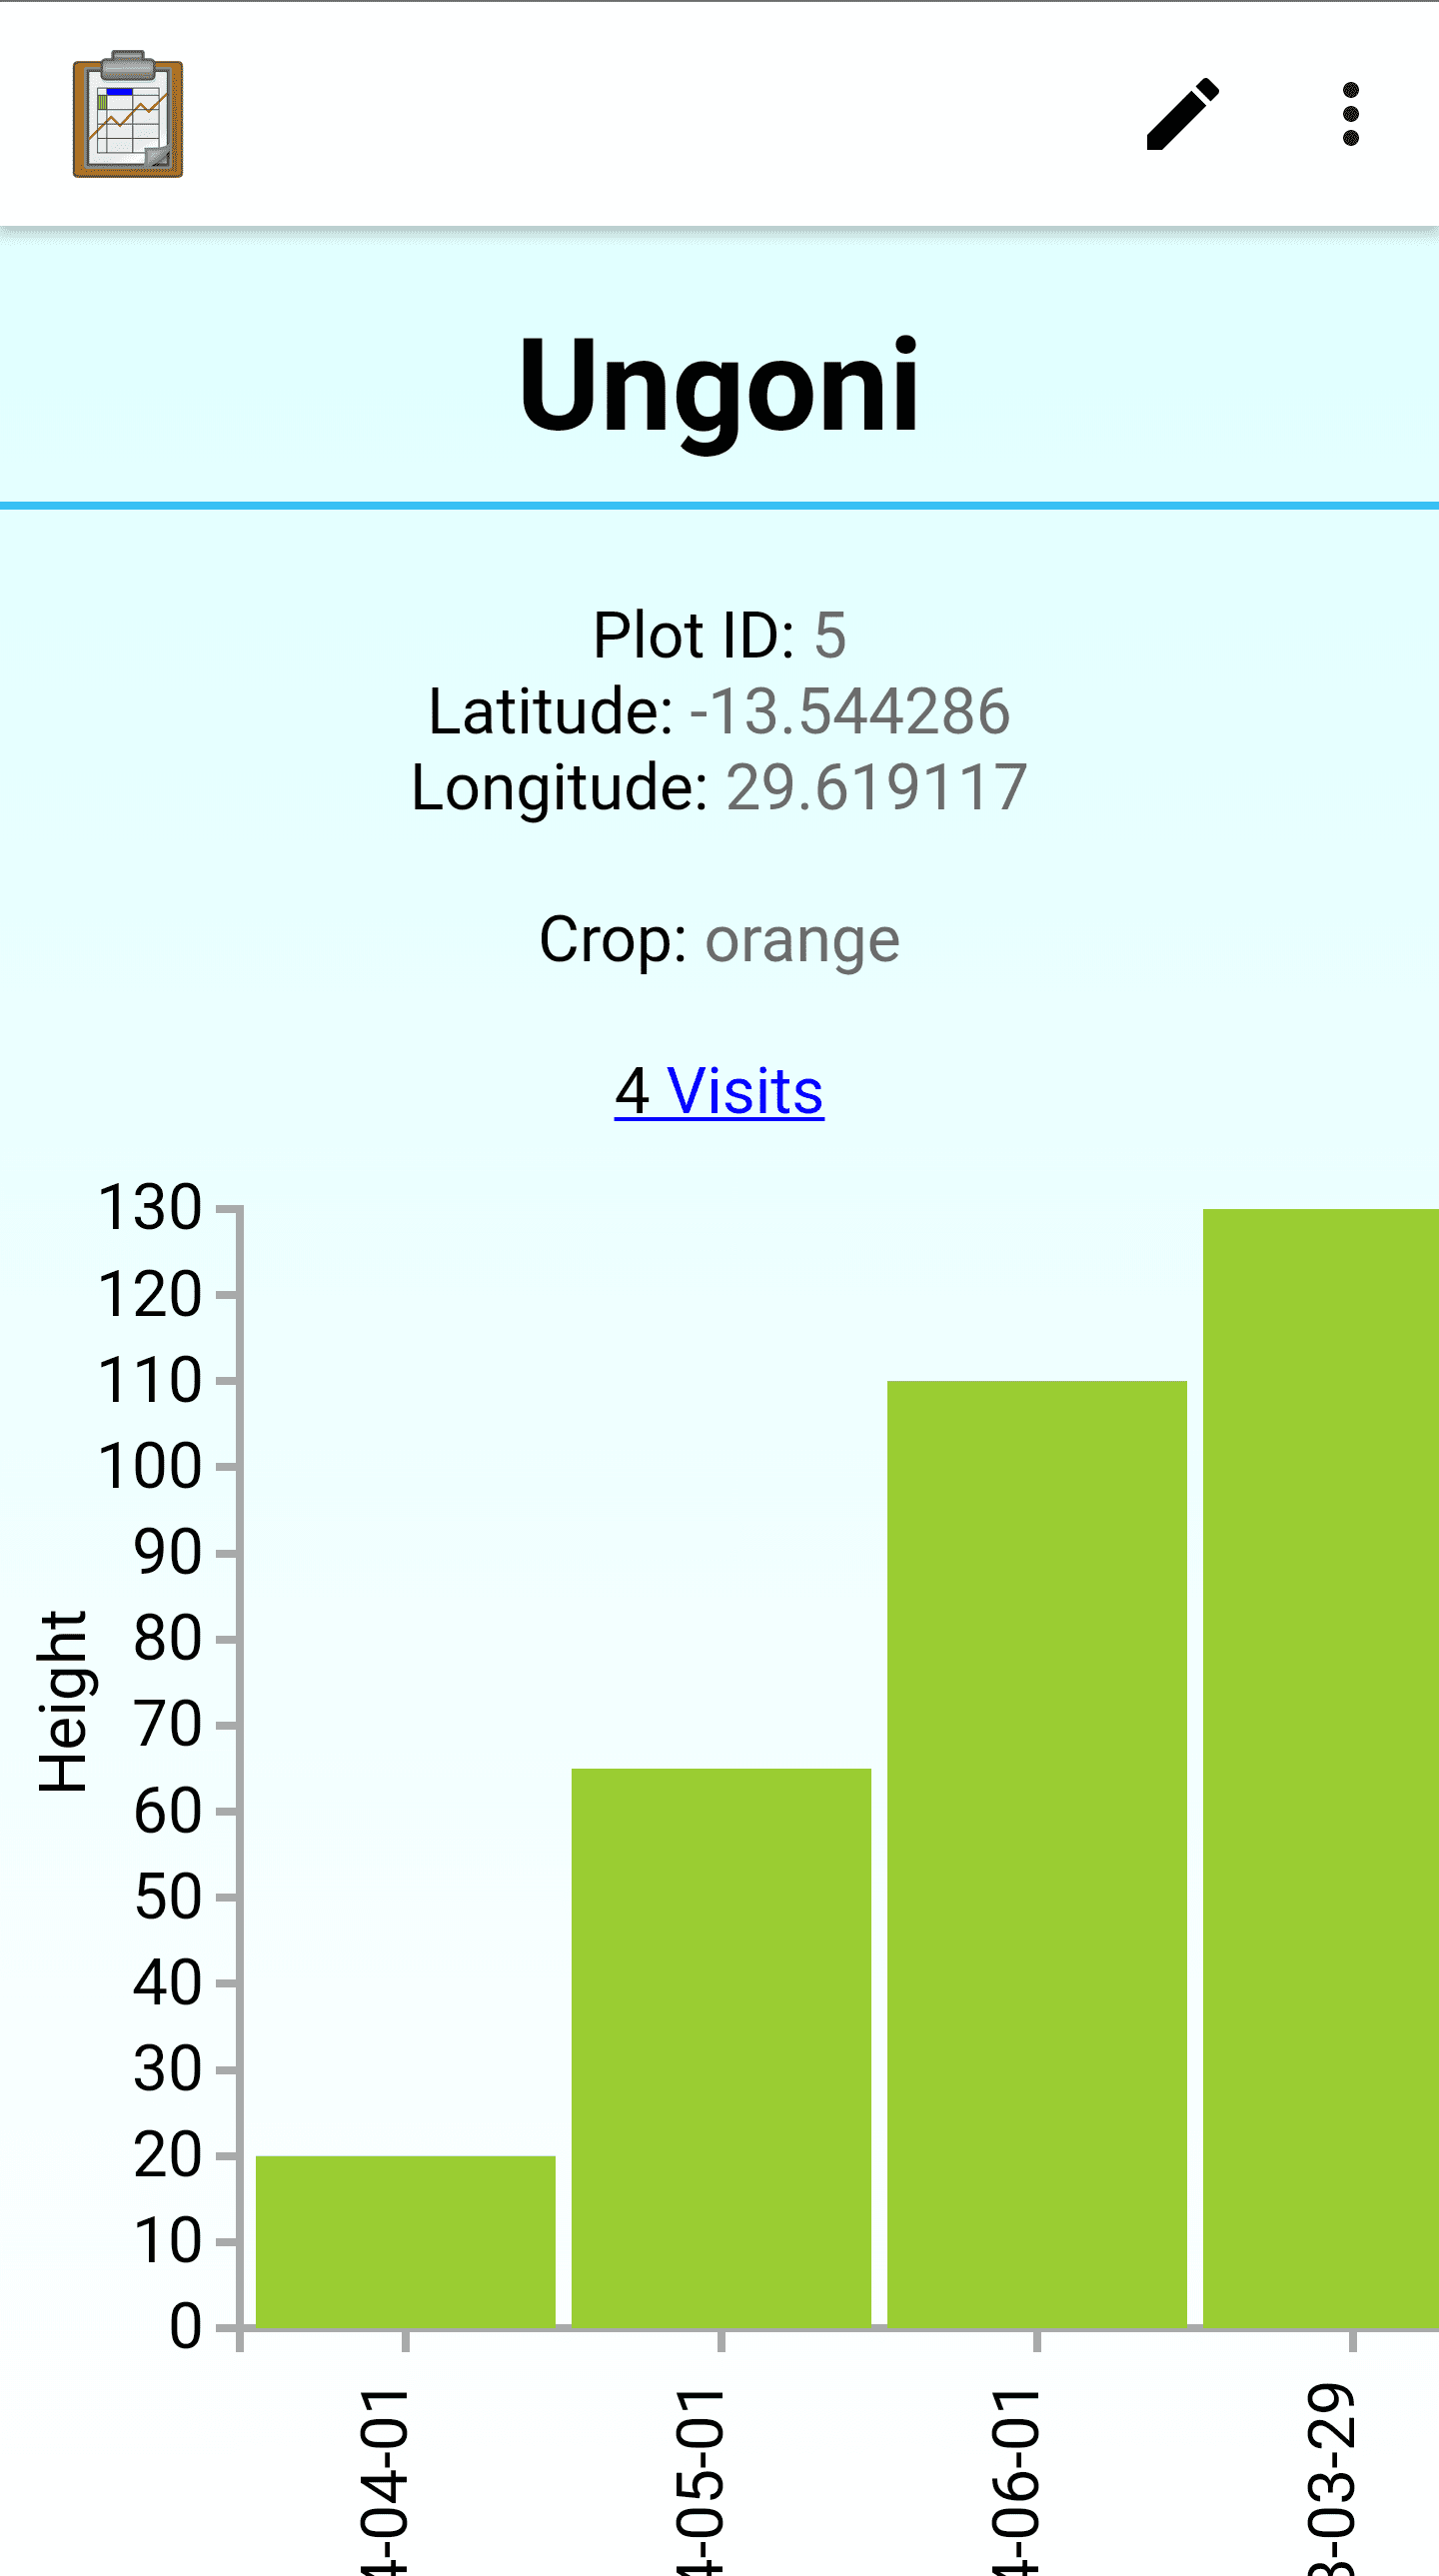
The screen shows a Graph View of the crop height data collected for the Ungoni site. The bar graph shows corn crop heights across three different visits to this farm.
Tip
The graph was rendered using the D3 JavaScript library. That library can render scatter plots, line graphs, graphs with error bars, and many other visualizations.
Updated Graph View
The graph was rendered on the device based on collected data. If new data is collected, this graph will be updated. To demonstrate that, let's perform a new visit. Scroll down the page and press the New Visit button.
This will launch Survey to a form that the Plot application specified. Advance through the form. Notice that some of the fields are prepopulated, such as the plot being observed. Be sure to leave that set to .
When you reach the prompt asking for crop height, enter: 130.
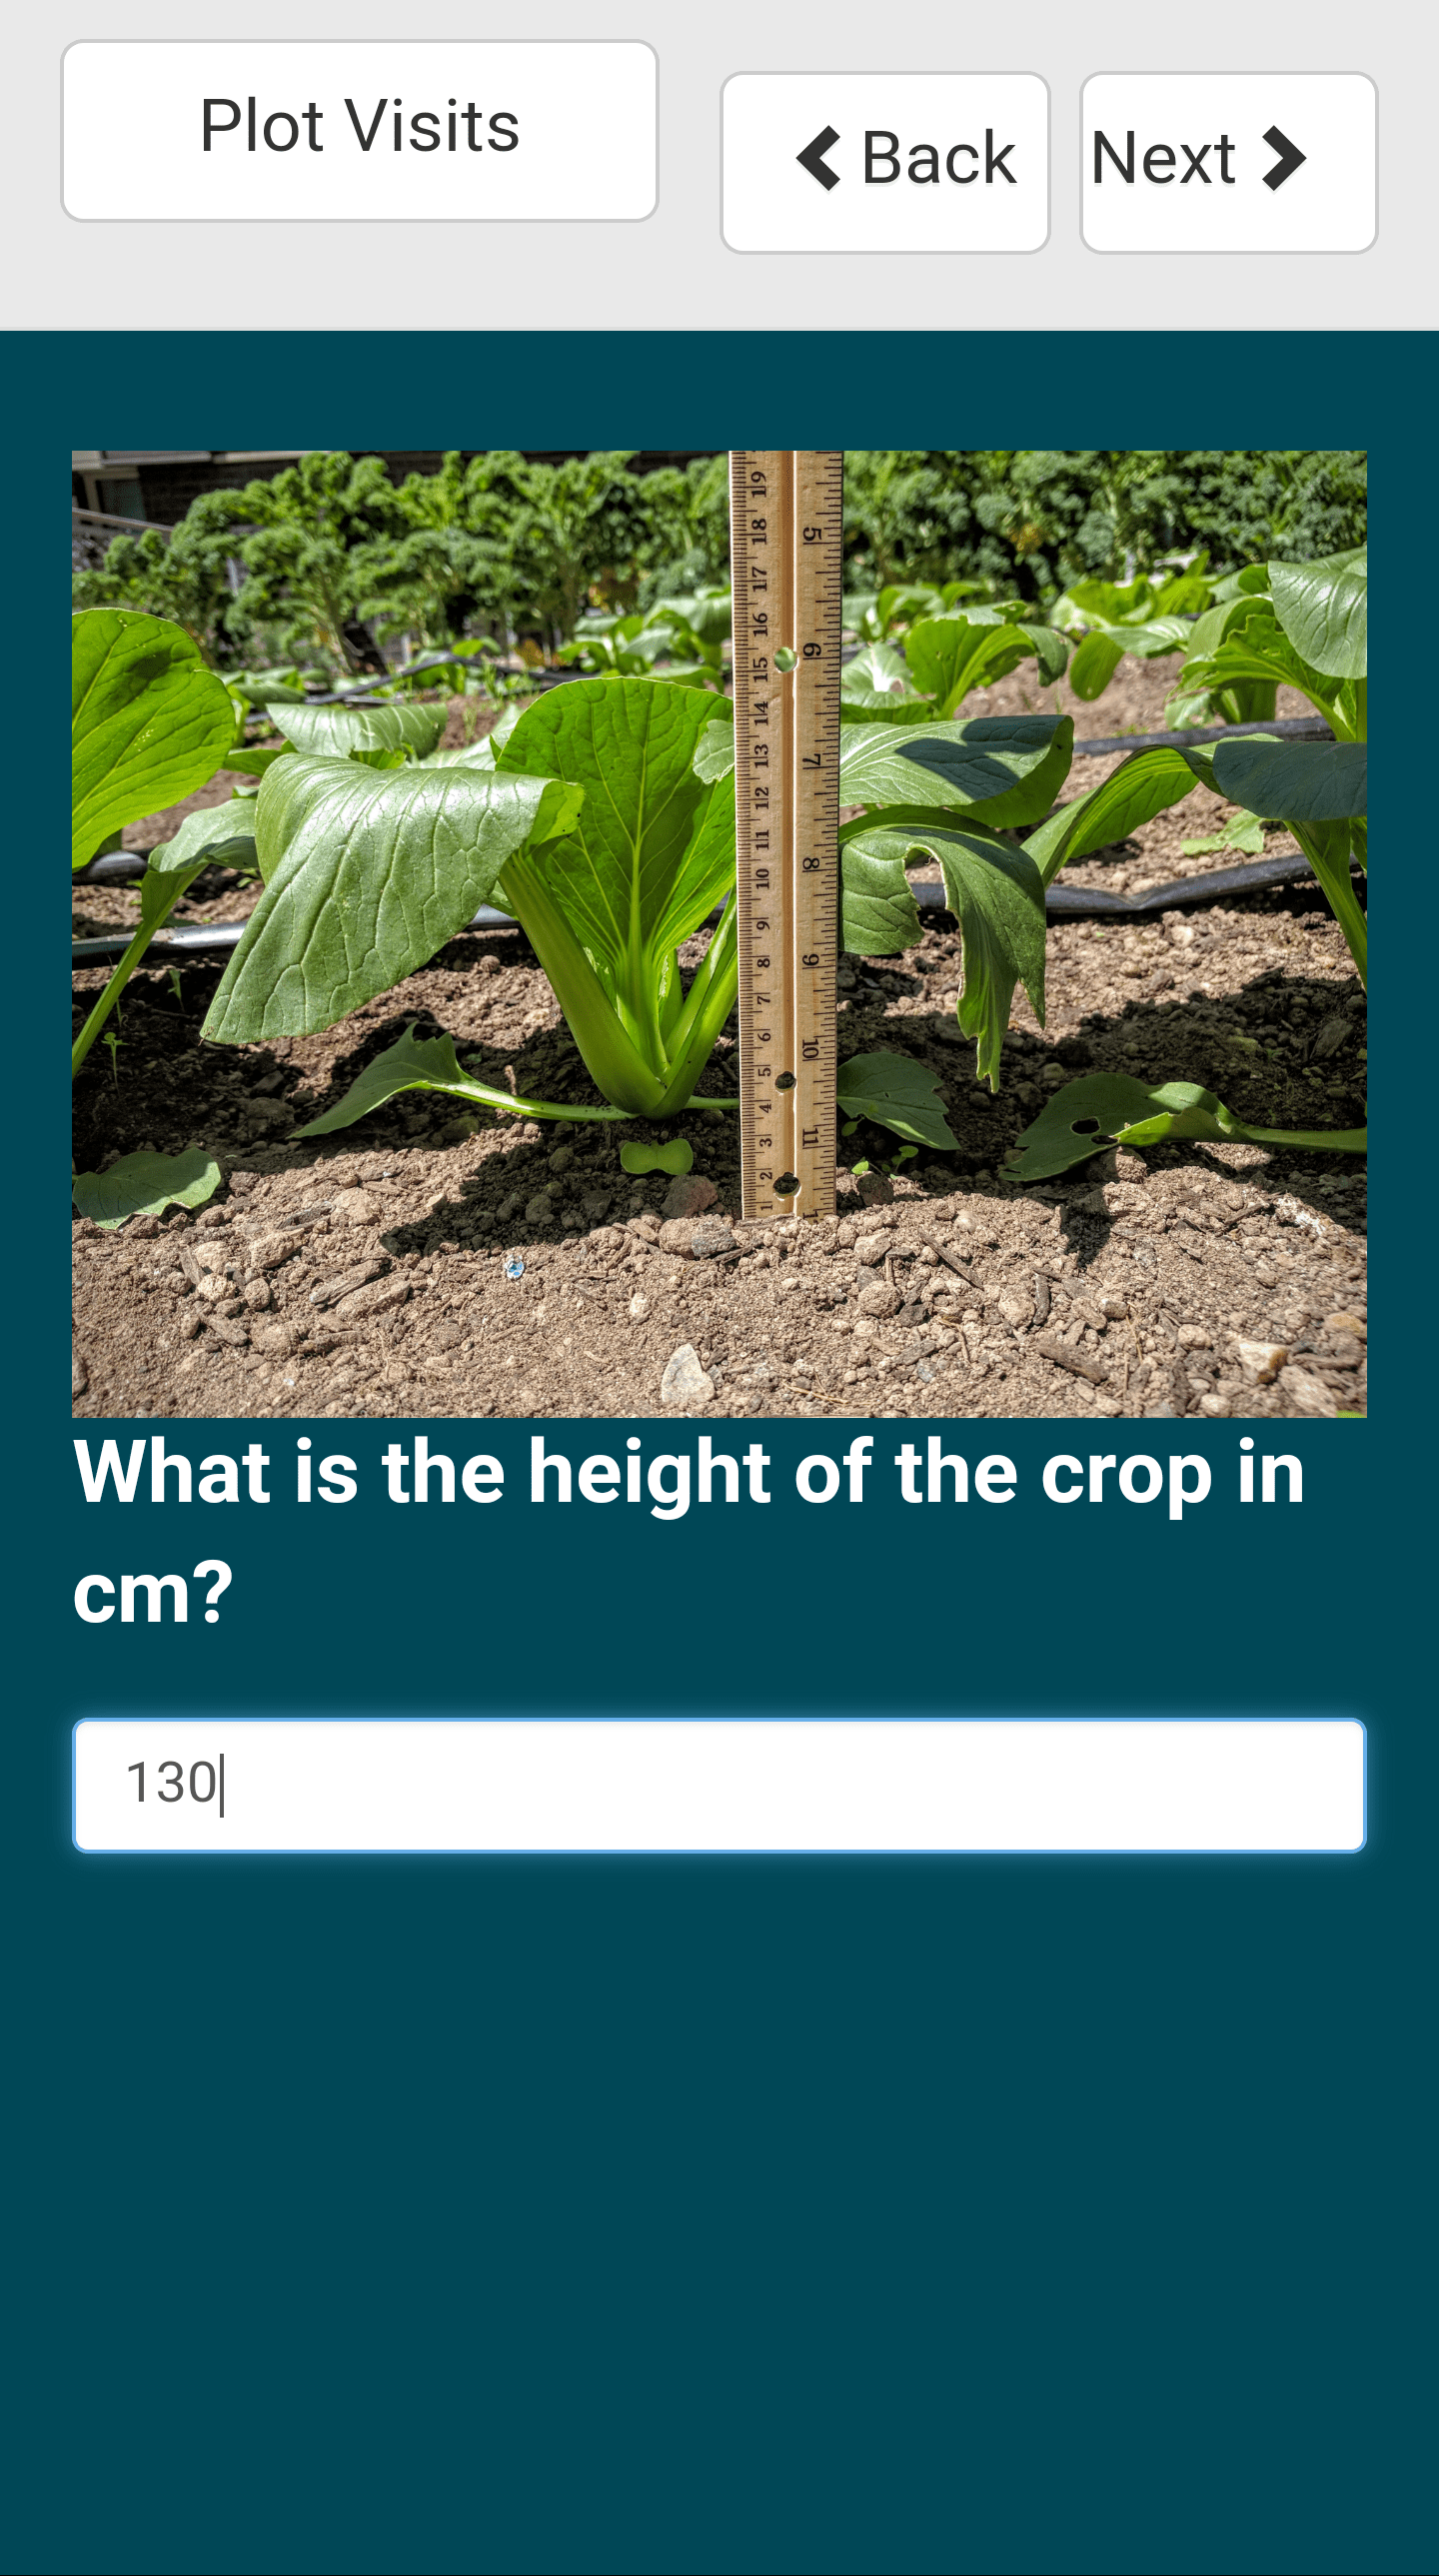
Advance through the rest of the form, entering any data you like. Finalize the changes. When you return to the Graph View notice that a new visit has been added to the graph.
Tour the rest of the Plot demo to see a variety of other Graph Views. These are all rendered in custom JavaScript, and could be customized to your organization's unique needs.
Next, launch the JGI Demo to see a demo of data collection directly through Tables.
Learn More
For more information about Graph View, view the Graph View guide.