Graph View
Function
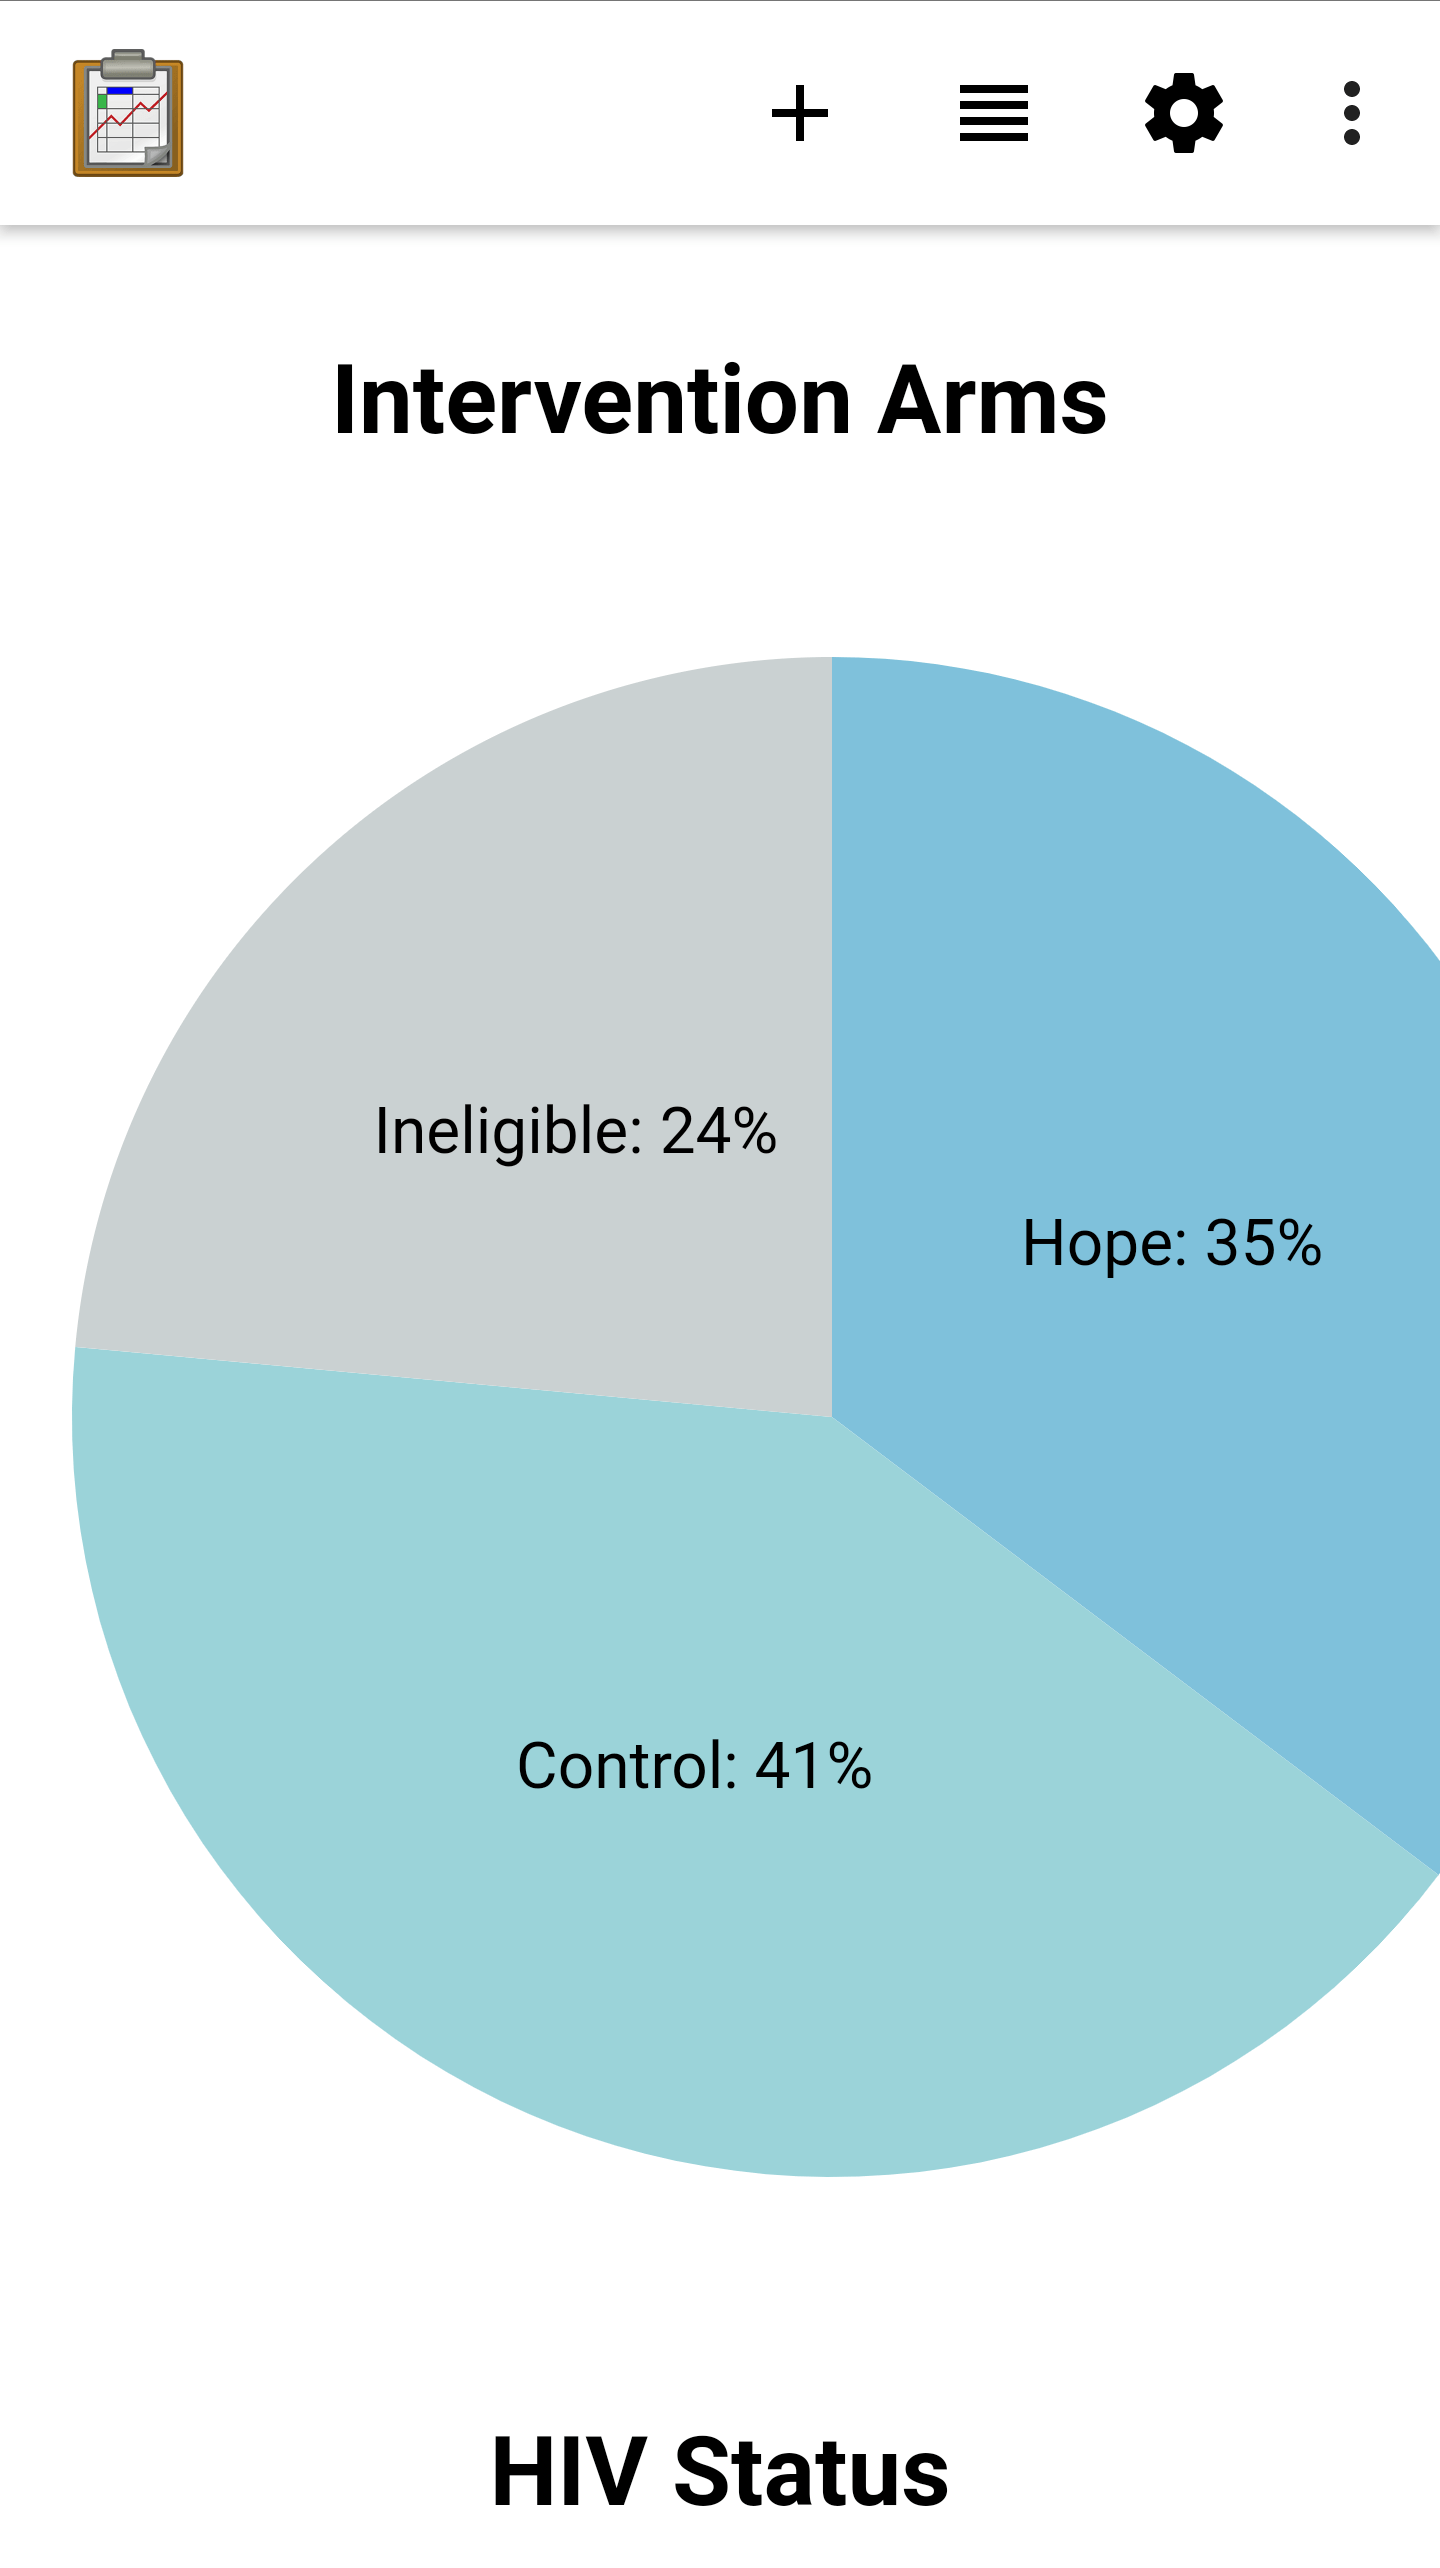
The Graph View module is a simple pair of pie chart displaying statistics about the current client pool. The first pie chart, titled Intervention Arms, displays the ratios of clients in each of the intervention arms: Hope, Control, or Ineligible. The second pie chart, titled HIV Status, shows the ratios of HIV+, HIV-, and untested respondents.
This view is currently displaying static data and does not reflect the true values in the database. This was done for simplicity in showing Tables features in the Sample Application: showing how a graph might look, despite not having real patient data initialized on the device. However, with a little a couple calls to the database and a little more JavaScript implementing the math, this could be updated dynamically.
Implementation
The implementation of this module is less interesting considering it does not show real data. However, it is still a useful display of how complex data visualizations can be rendered on the device, without outside processing or internet access. The file tables/femaleClients/html/graph_view.html makes use of the third-party D3 JavaScript library to draw the pie charts.
To ratios are fed into the graph rendering in the display(...) function. If these were replaces with variables, and those variables were populated by summing up results of calls to the database with odkData.query(...) and odkData.arbitraryQuery(...), the graphs would be update according to the real data. This can be performed by the diligent reader as an exercise.
Files
tables/femaleClients/html/graph_view.html
Forms
None
Database Tables
None